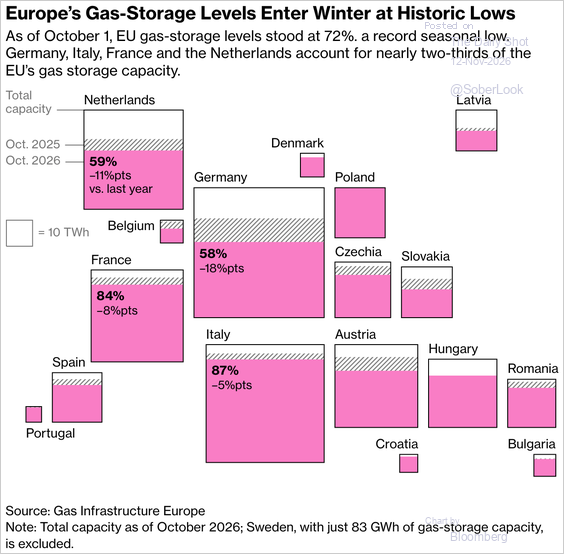
EU gas storage stood at 72% on 1 October, a record seasonal low, with Germany at 58%, 18 points below a year earlier. Thin buffers leave European gas, power and carbon more exposed to cold spells and supply shocks this winter.
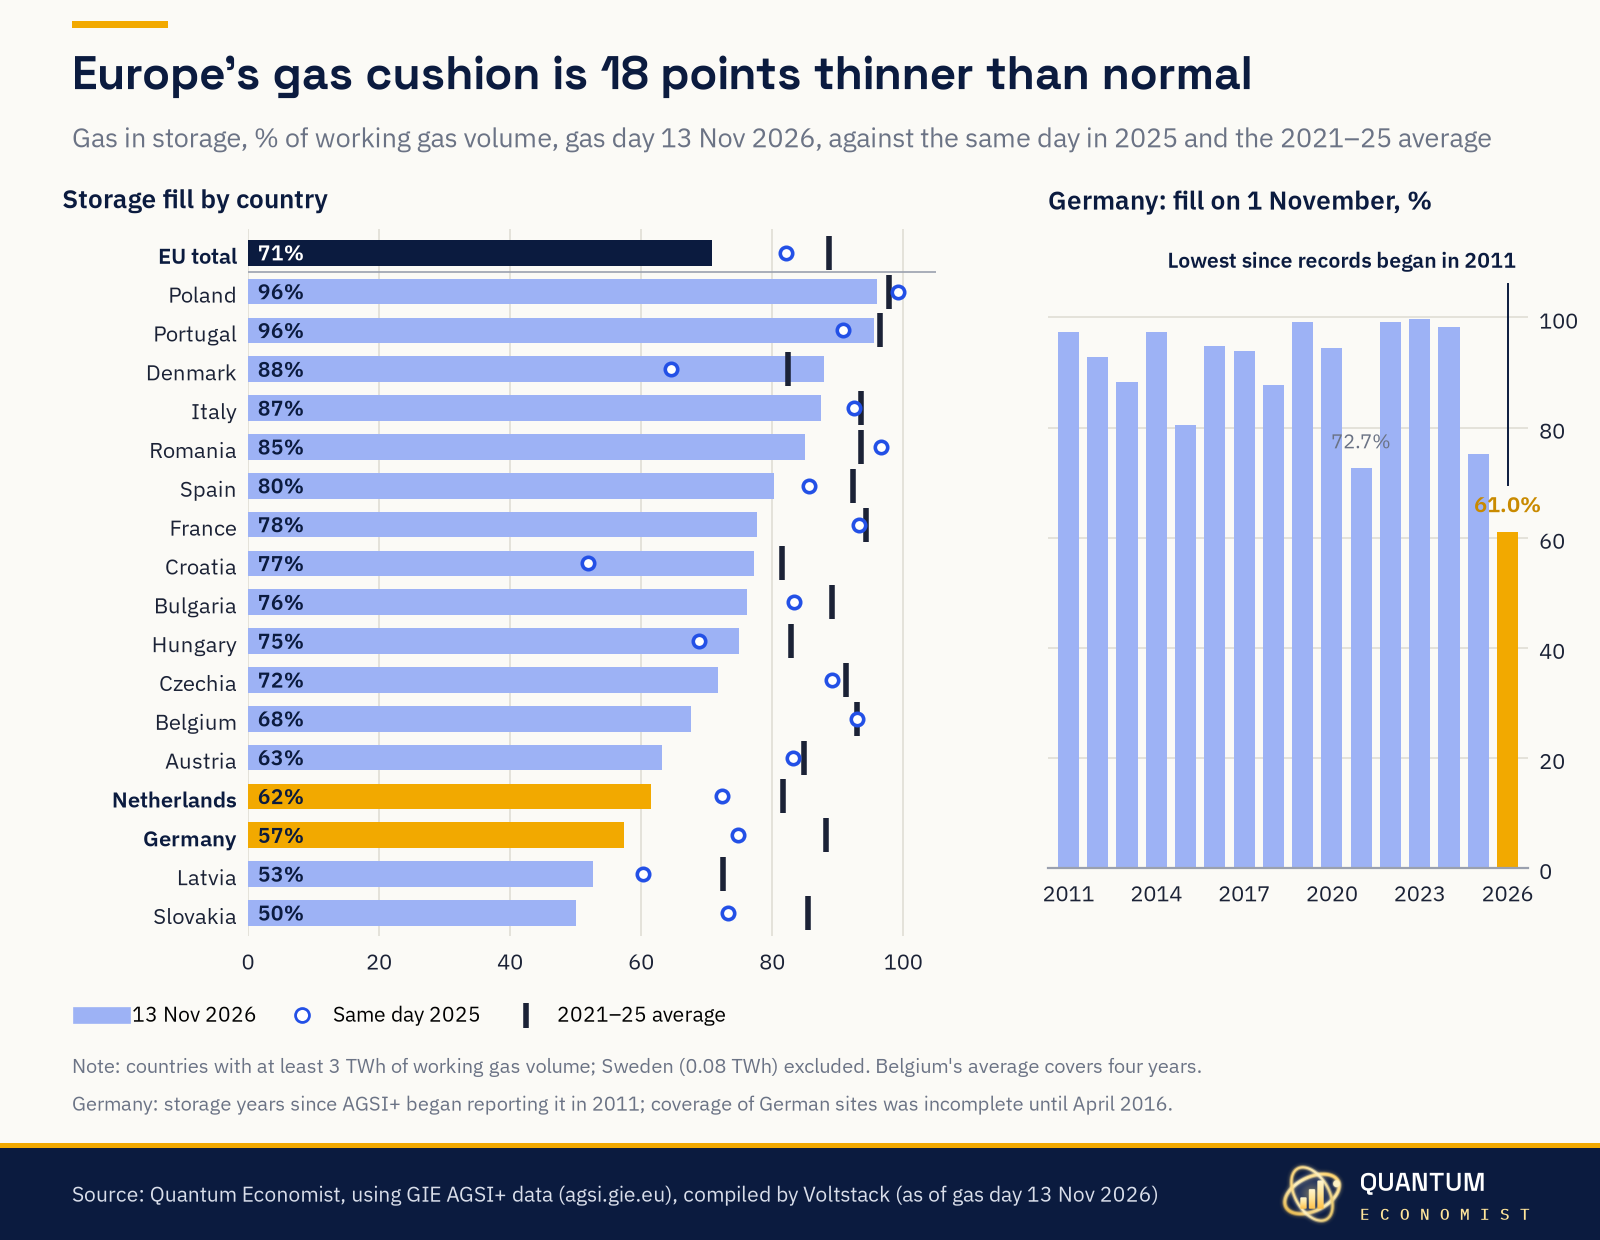
EU gas storage stood at 71% on 13 November, against an 89% average for the same day in 2021–25. Germany's fill on 1 November was its lowest since records began in 2011, and the Netherlands is at 62%. With buffers this thin, a cold snap would hit gas and power prices quickly.
· Source: Quantum Economist, using data from GIE AGSI+ (compiled by Voltstack)
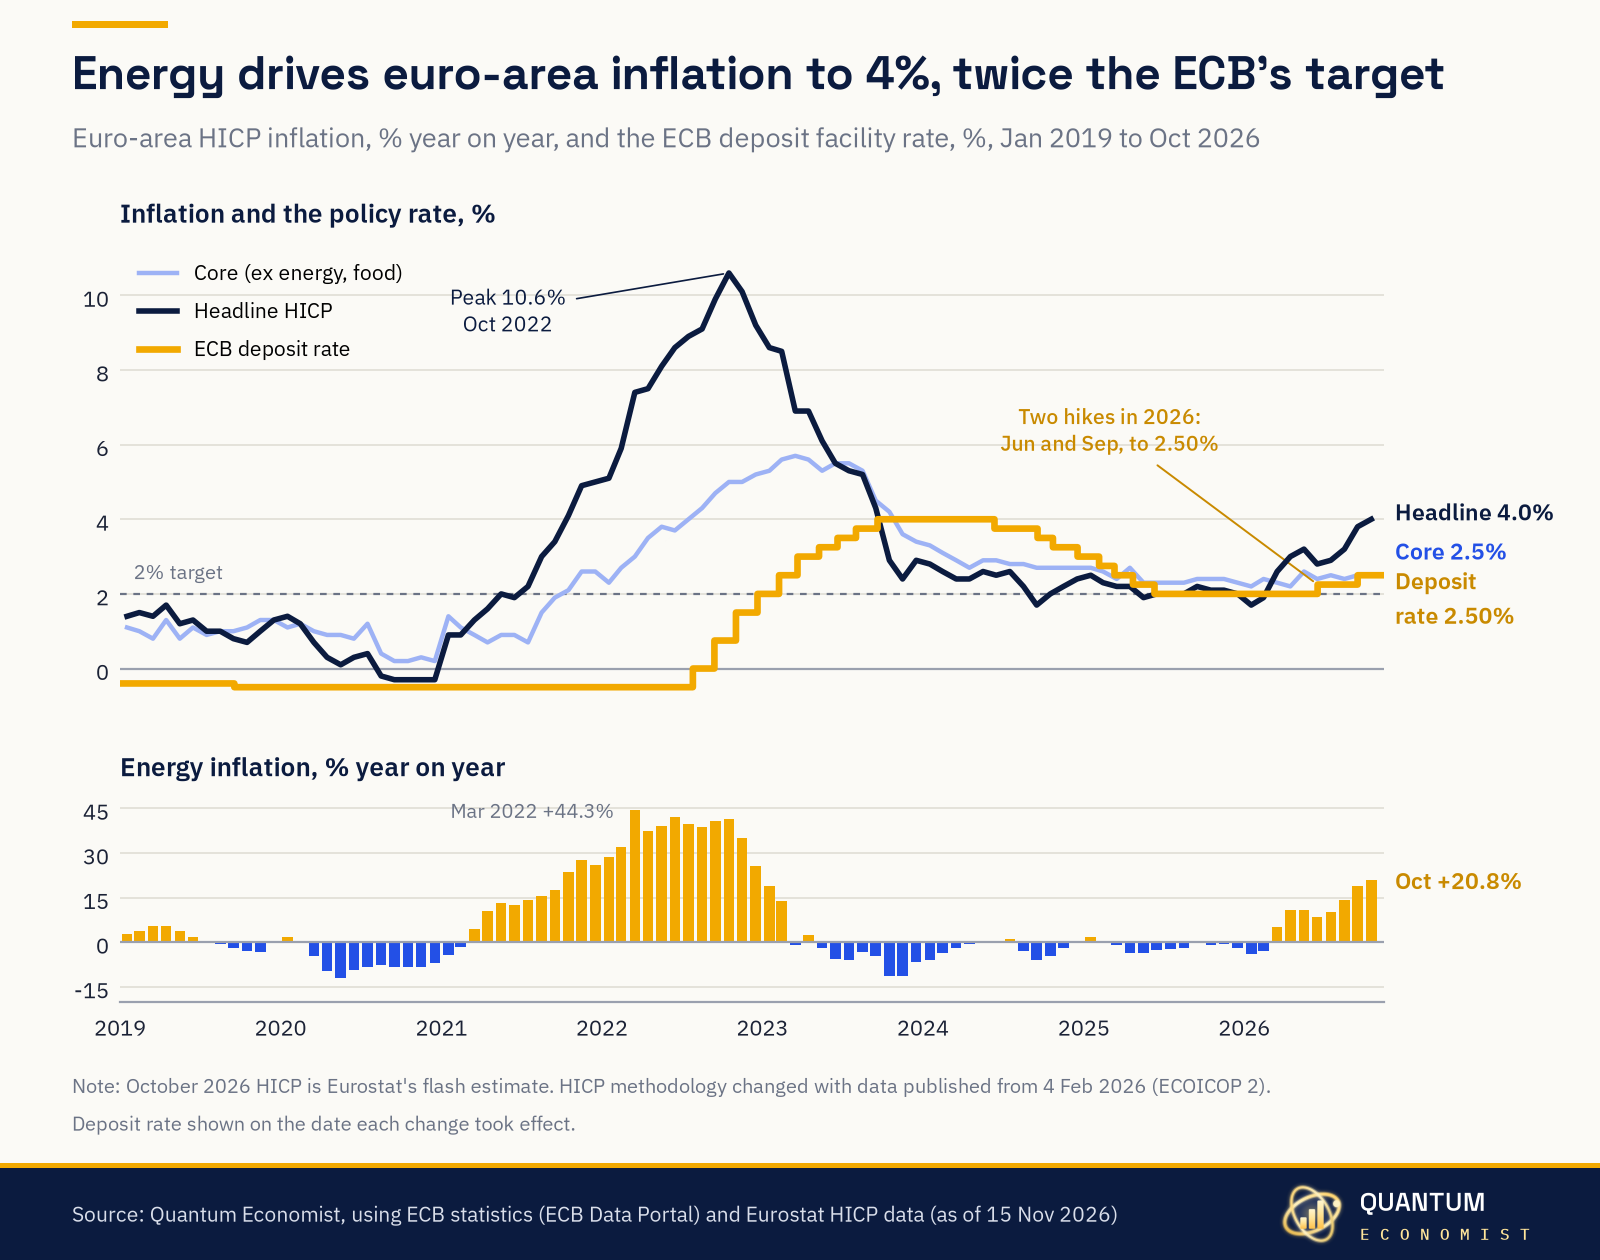
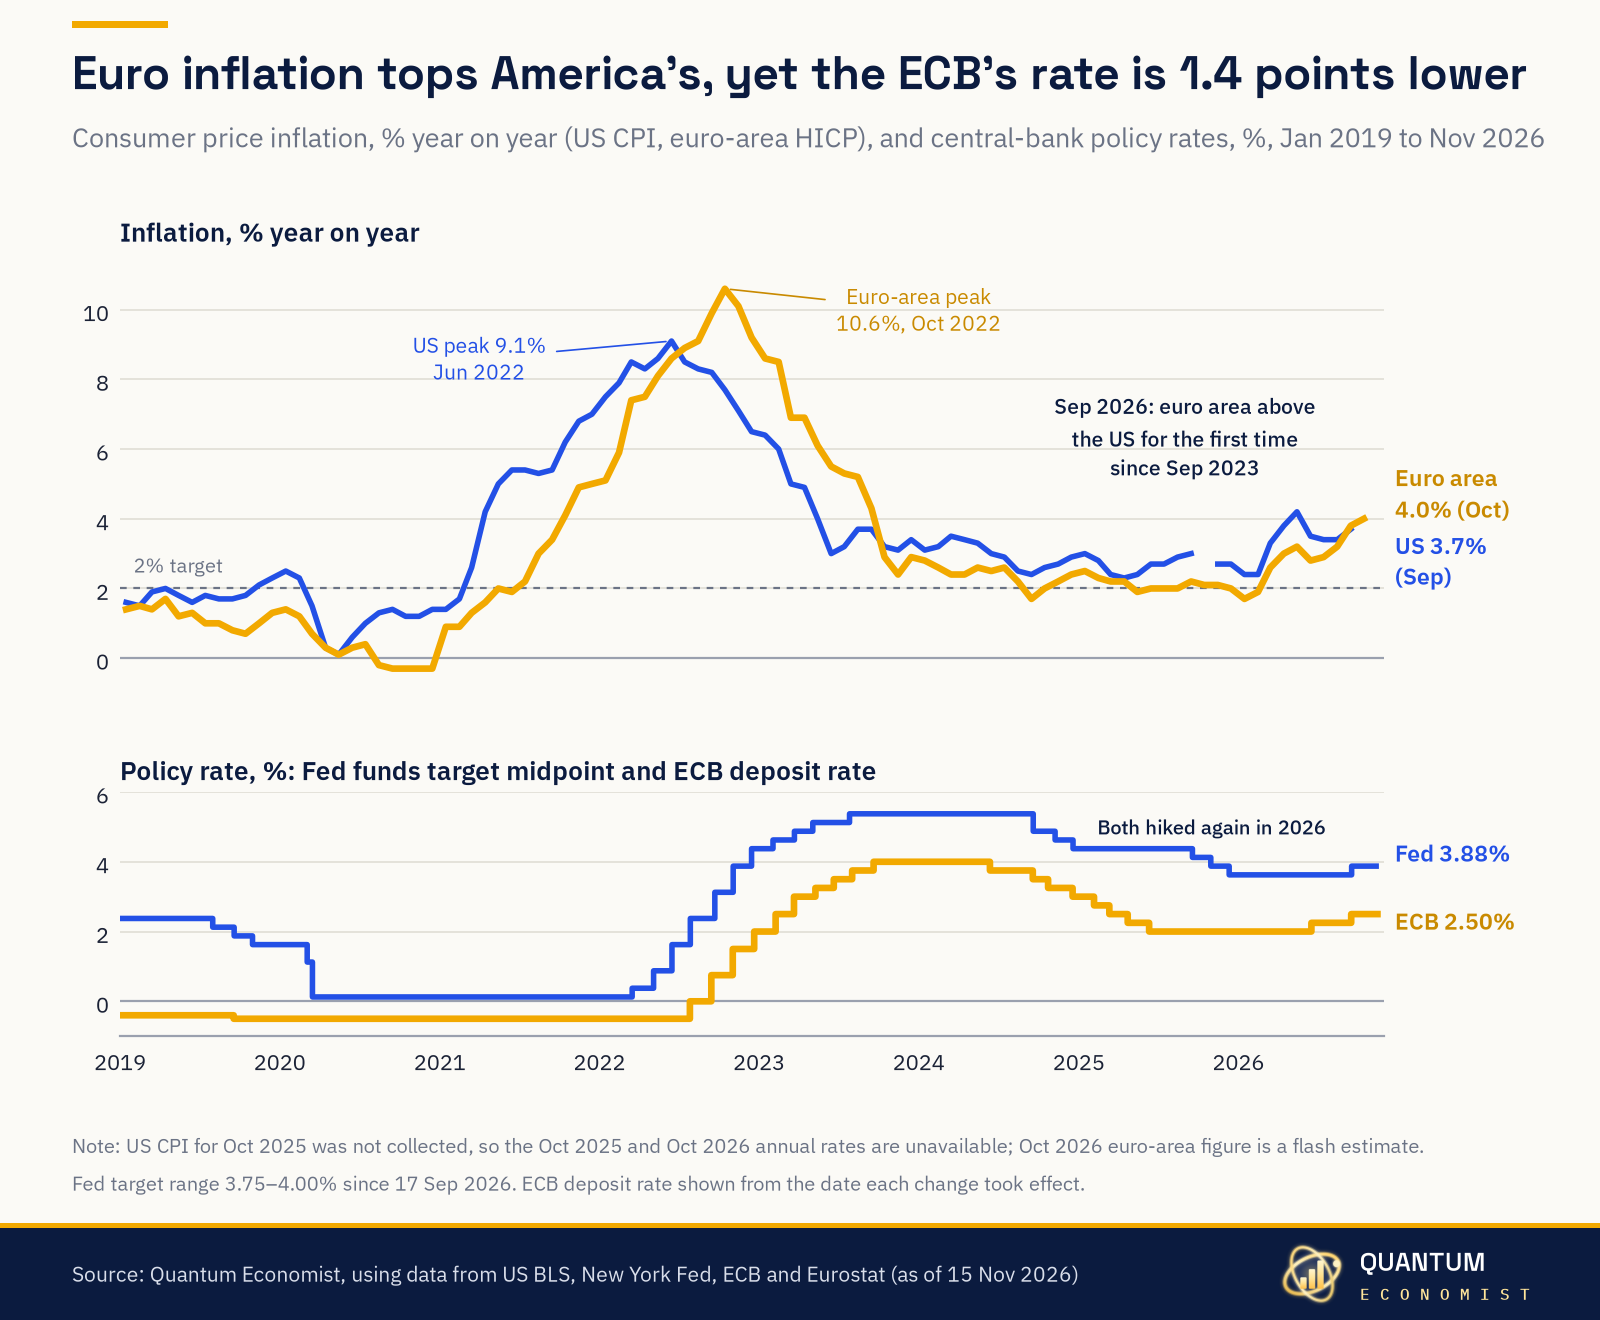
Euro-area inflation reached 4.0% in October on Eurostat's flash estimate, with energy prices up 20.8% on a year earlier. The ECB has raised its deposit rate twice this year, to 2.50%, but policy is still loose once inflation is taken into account.
· Source: Quantum Economist, using data from the ECB Data Portal and Eurostat
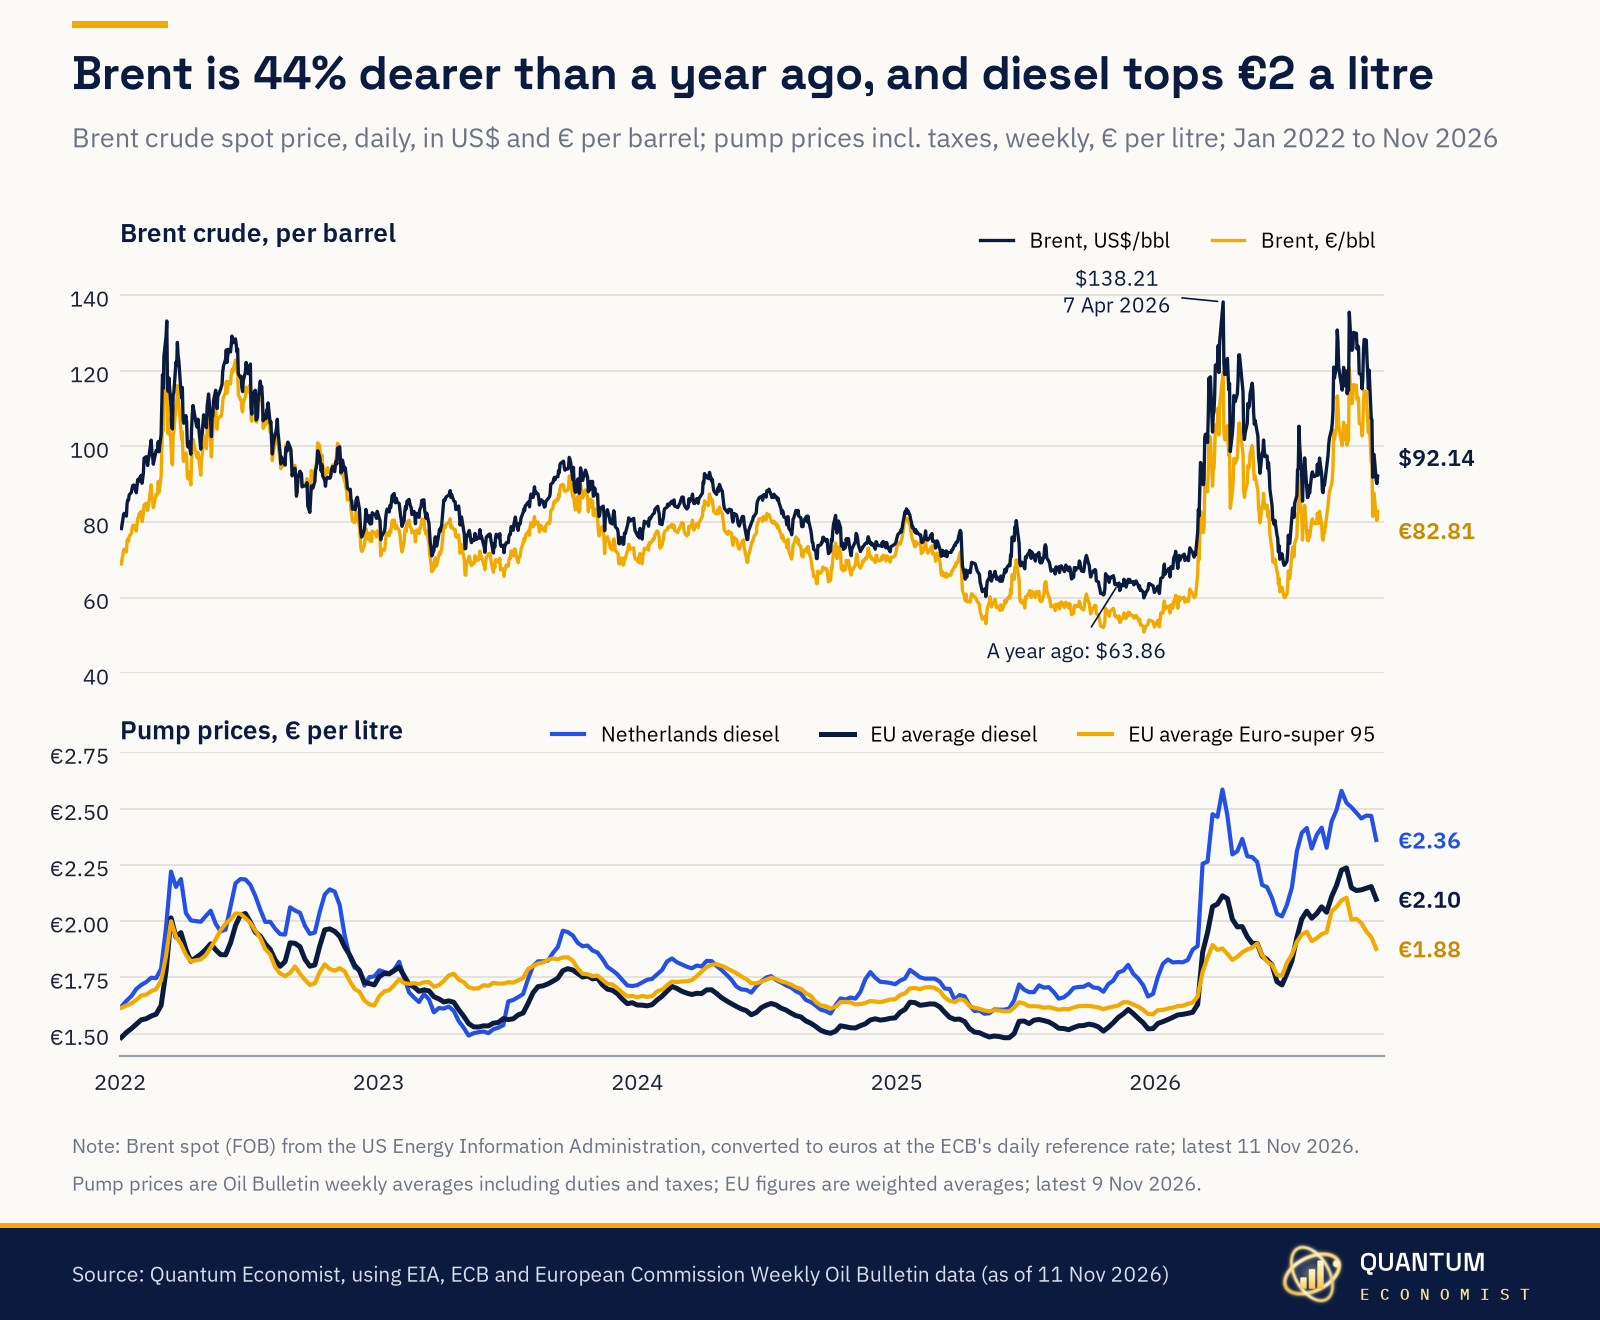
Brent crude is at about $92 a barrel, 44% higher than a year ago. At the pump, diesel now averages €2.10 a litre across the EU and €2.36 in the Netherlands, so the oil shock is reaching household budgets directly.
· Source: Quantum Economist, using data from the EIA, ECB and European Commission Weekly Oil Bulletin
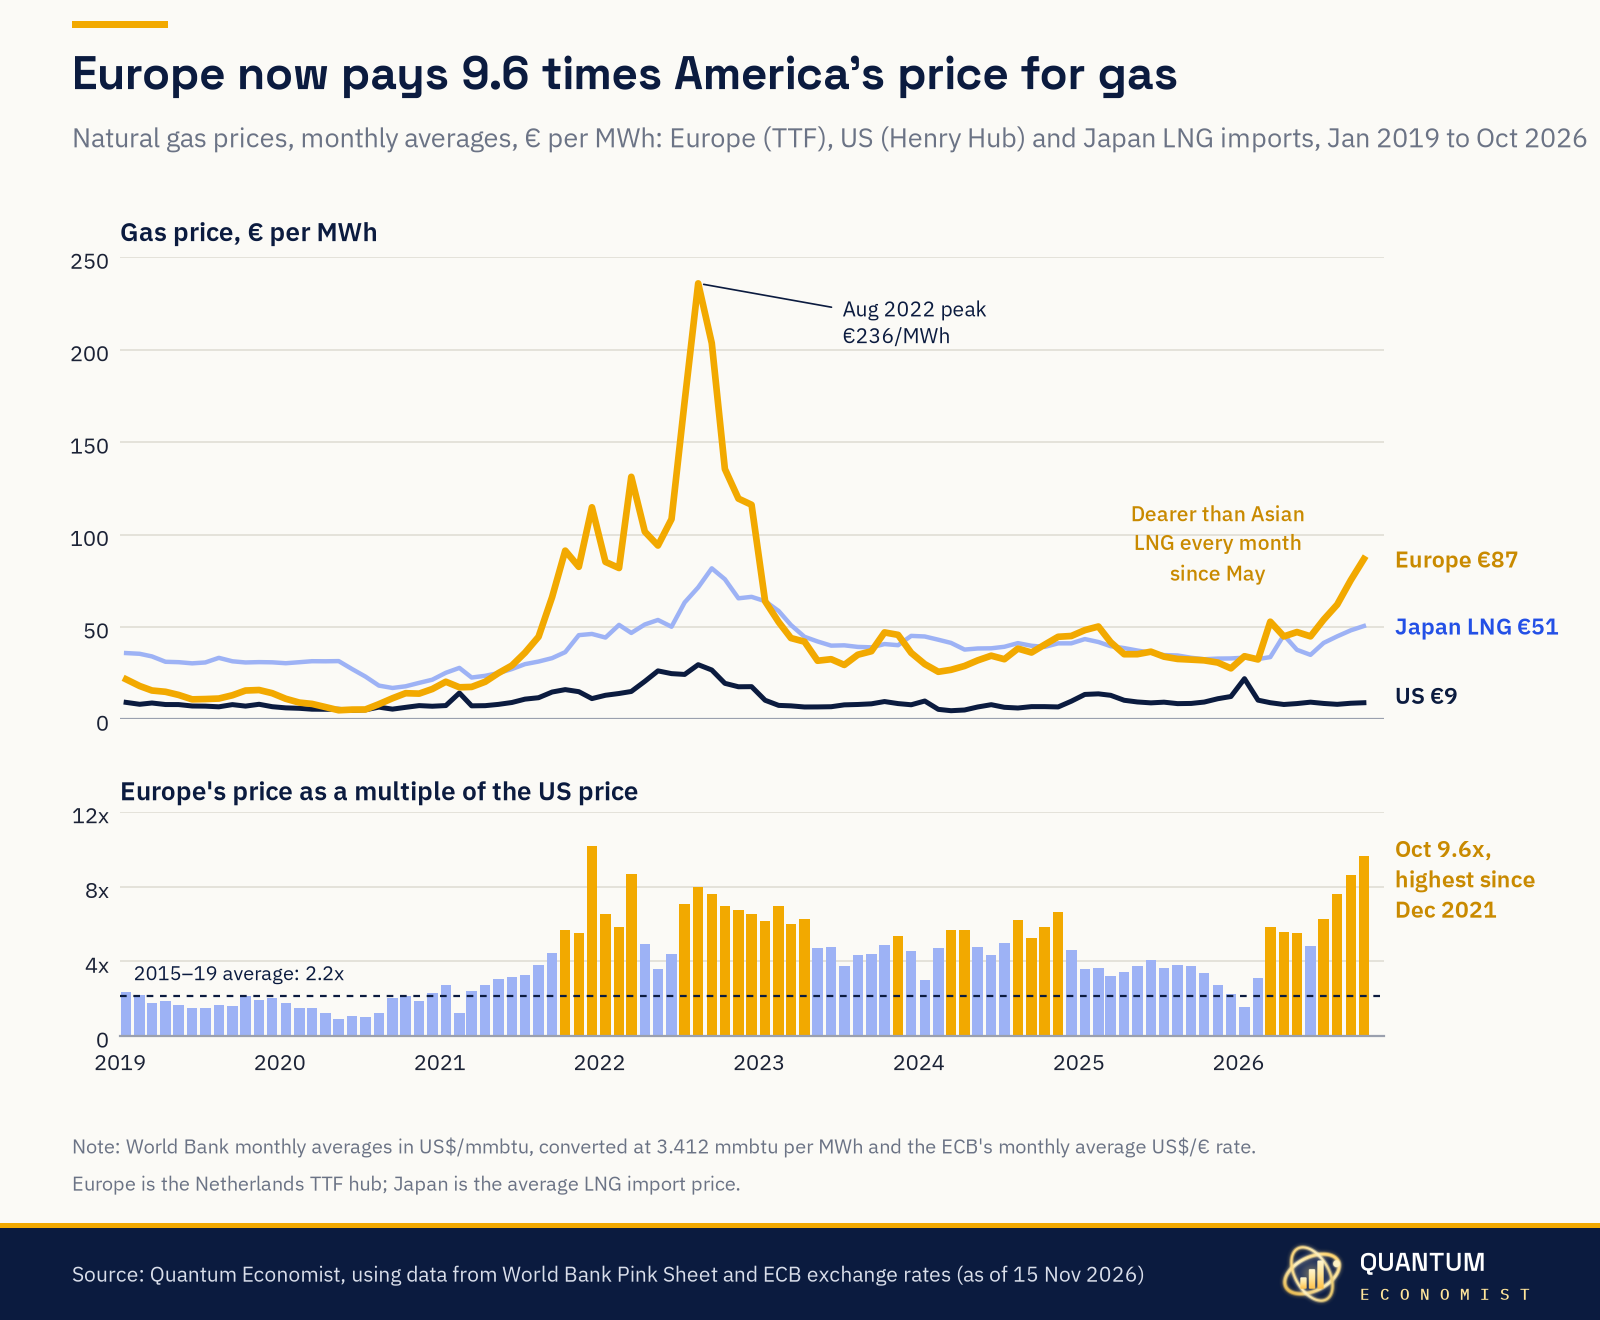
European gas (TTF) averaged €87/MWh in October, against €9 at Henry Hub in the US, the widest gap since December 2021 and far above the 2015–19 average of 2.2 times. Europe has also paid more than the Japan LNG import price every month since May, leaving Dutch households and industry far more exposed than American ones.
· Source: Quantum Economist, using data from the World Bank Pink Sheet and ECB
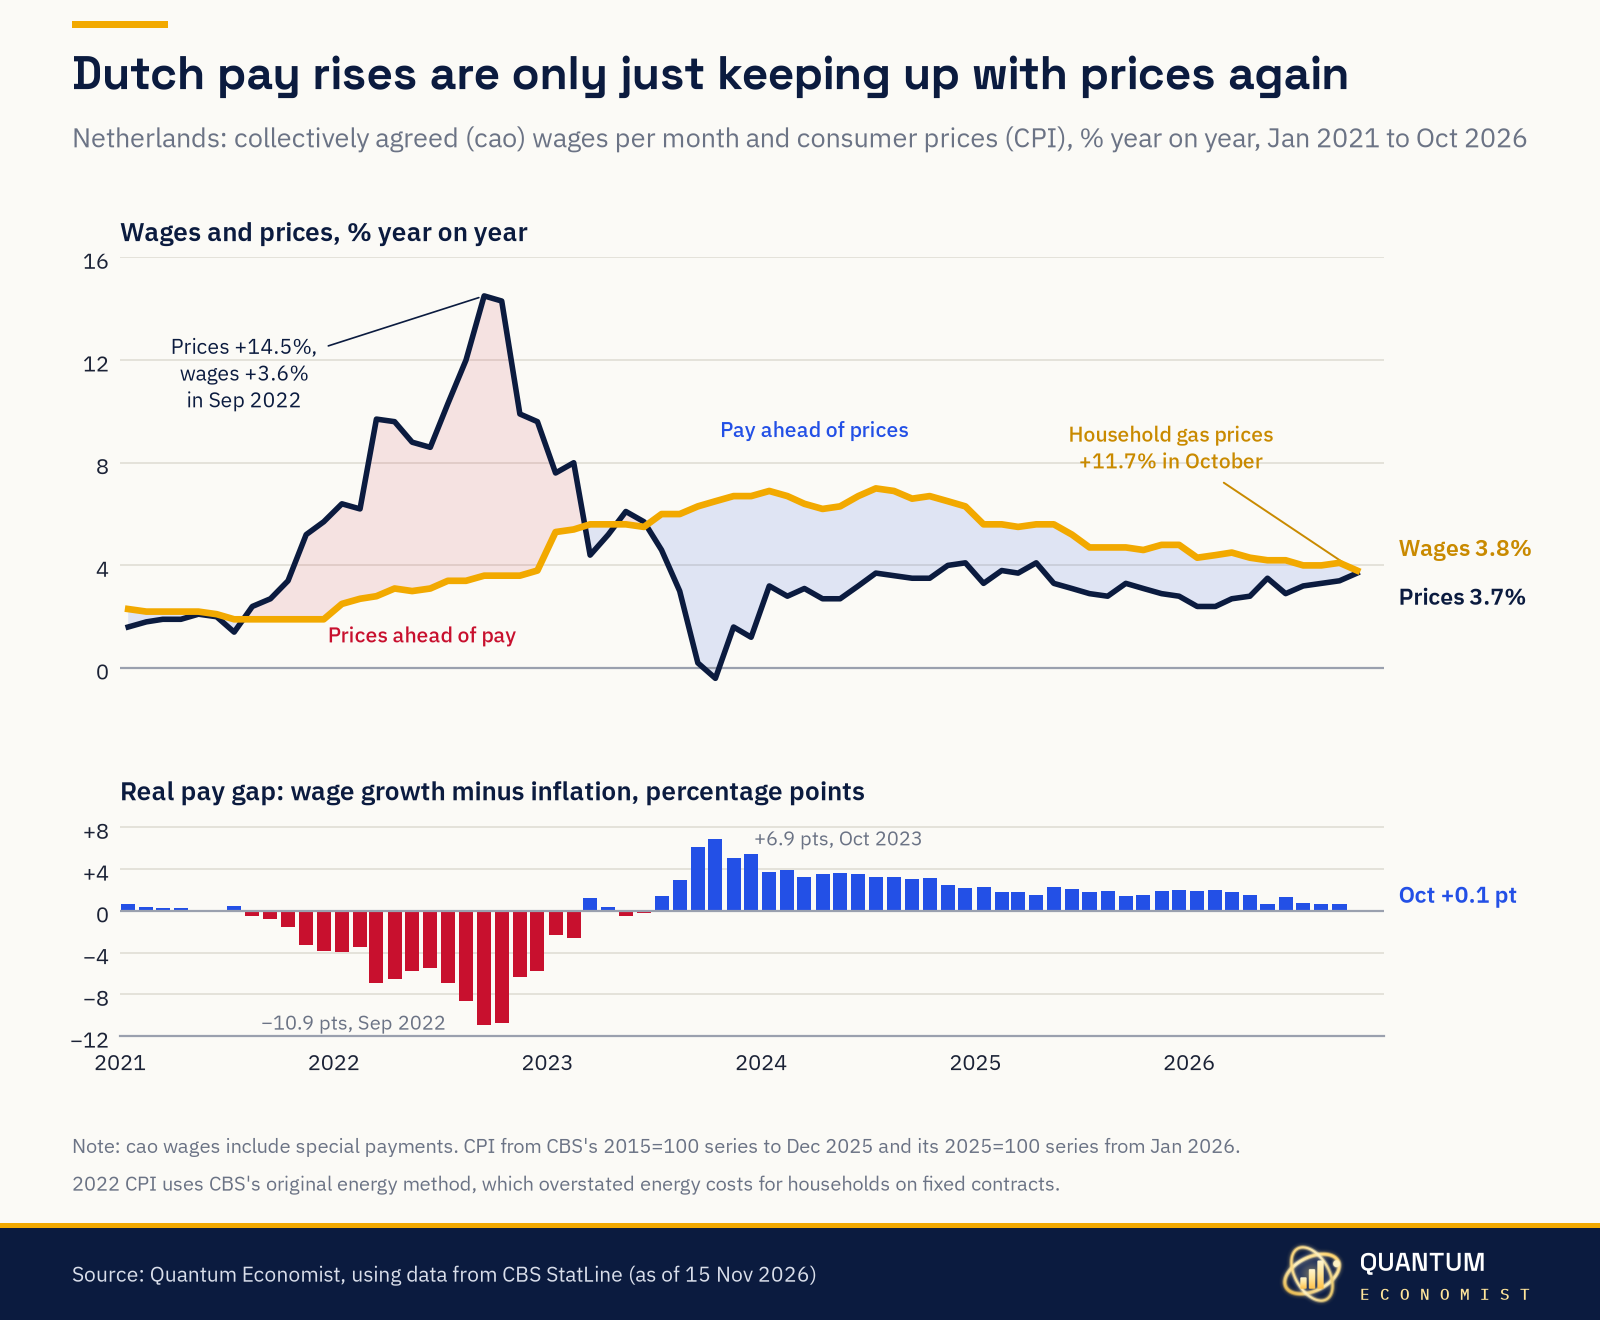
Dutch collective-agreement wages were 3.8% higher in October than a year earlier, while consumer prices rose 3.7%, so real pay growth is down to just +0.1 point from +6.9 points at the October 2023 peak. Household gas prices, up 11.7% on a year ago, are eating the gain.
· Source: Quantum Economist, using data from CBS StatLine
In September euro-area inflation (3.8%) rose above US inflation (3.7%) for the first time since September 2023, and the October flash puts it at 4.0%. Yet the ECB deposit rate is 2.50% against a Fed midpoint of 3.88%, leaving euro-area real rates at about −1.5%.
· Source: Quantum Economist, using data from the US BLS, New York Fed, ECB and Eurostat
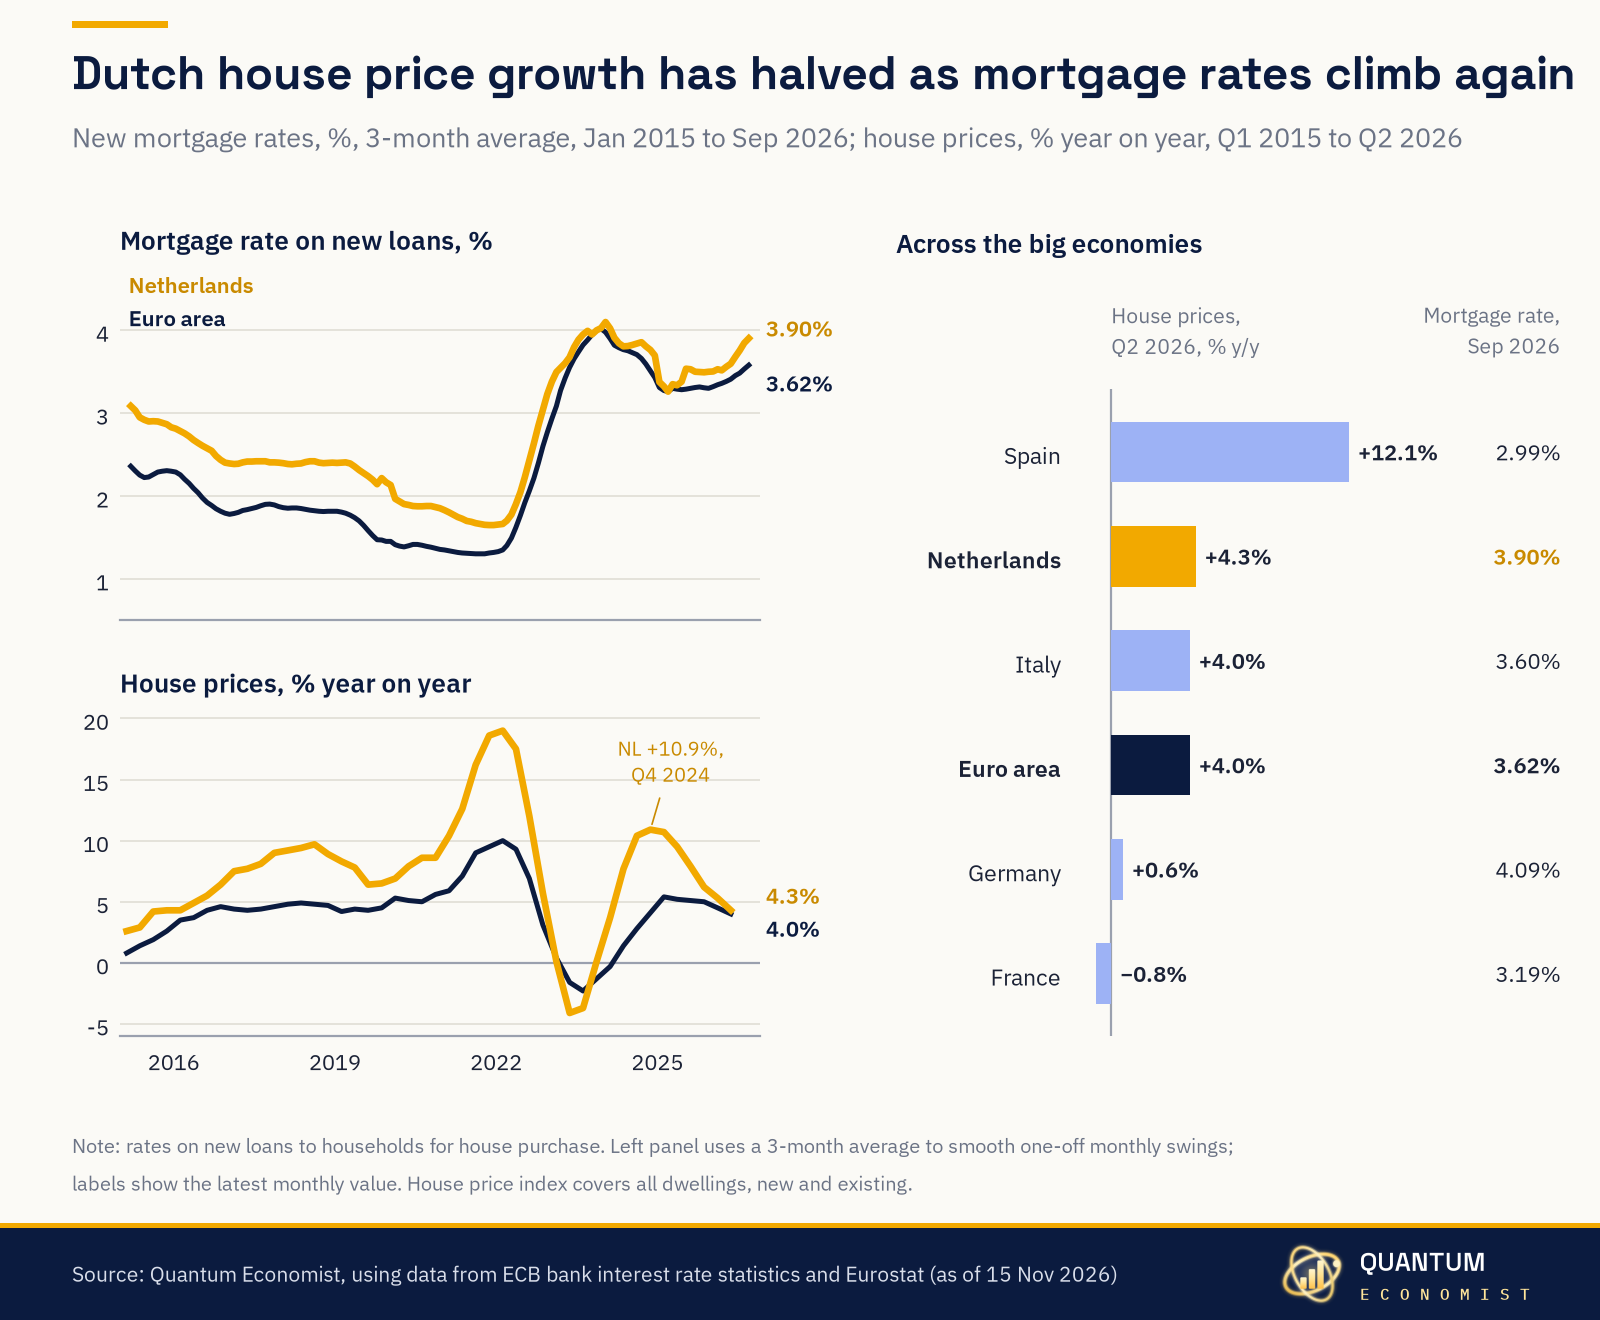
Dutch house prices rose 4.3% in the year to Q2 2026, down from 10.9% in Q4 2024, as new mortgage rates climbed from about 3.5% to 3.90% in September. Across Europe the pattern holds: Spain has the cheapest mortgages and the fastest price growth, Germany the dearest and prices barely moving.
· Source: Quantum Economist, using data from the ECB and Eurostat
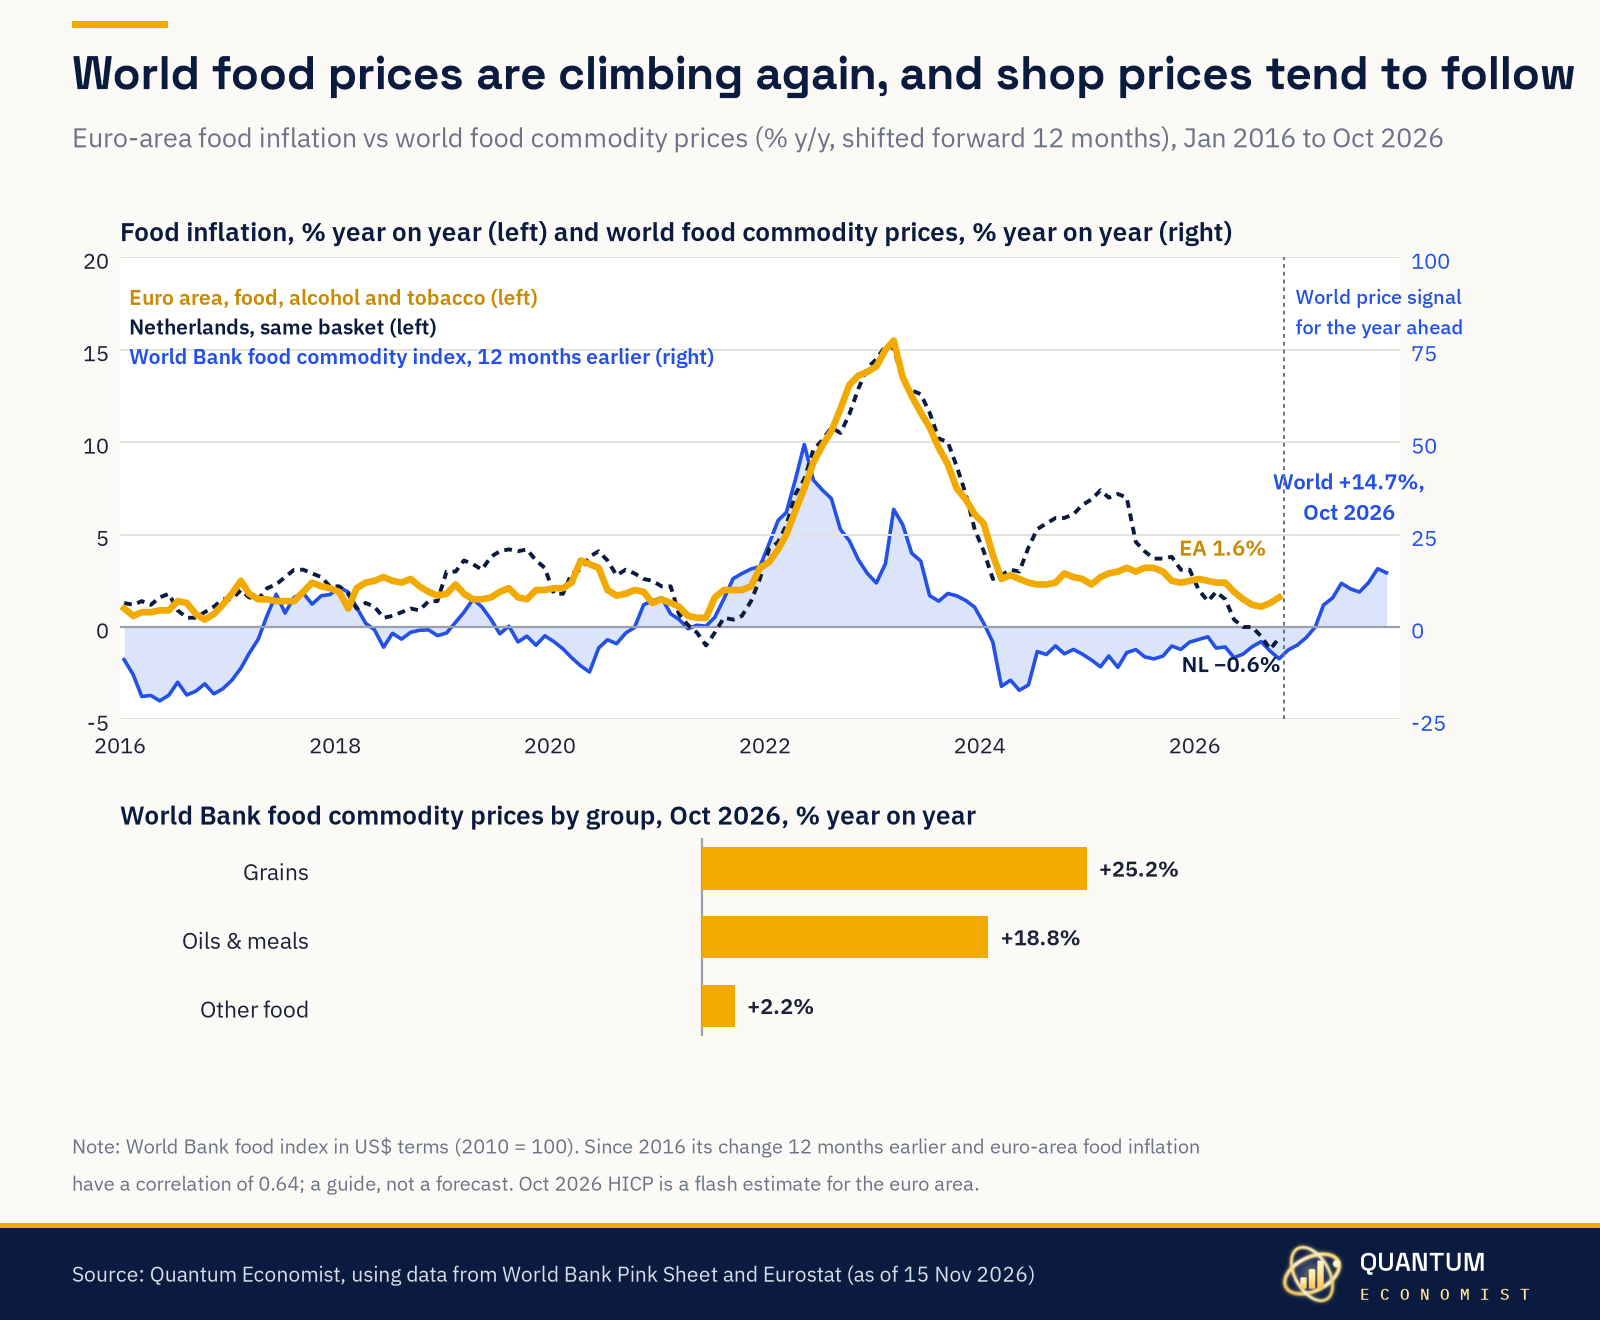
The World Bank food commodity index is up 14.7% on a year ago, led by grains (+25.2%), but euro-area food inflation is only 1.6% and the Dutch rate is −0.6%. Since 2016 world prices have led shop prices by about a year, which points to firmer supermarket prices in 2027.
· Source: Quantum Economist, using data from the World Bank Pink Sheet and Eurostat
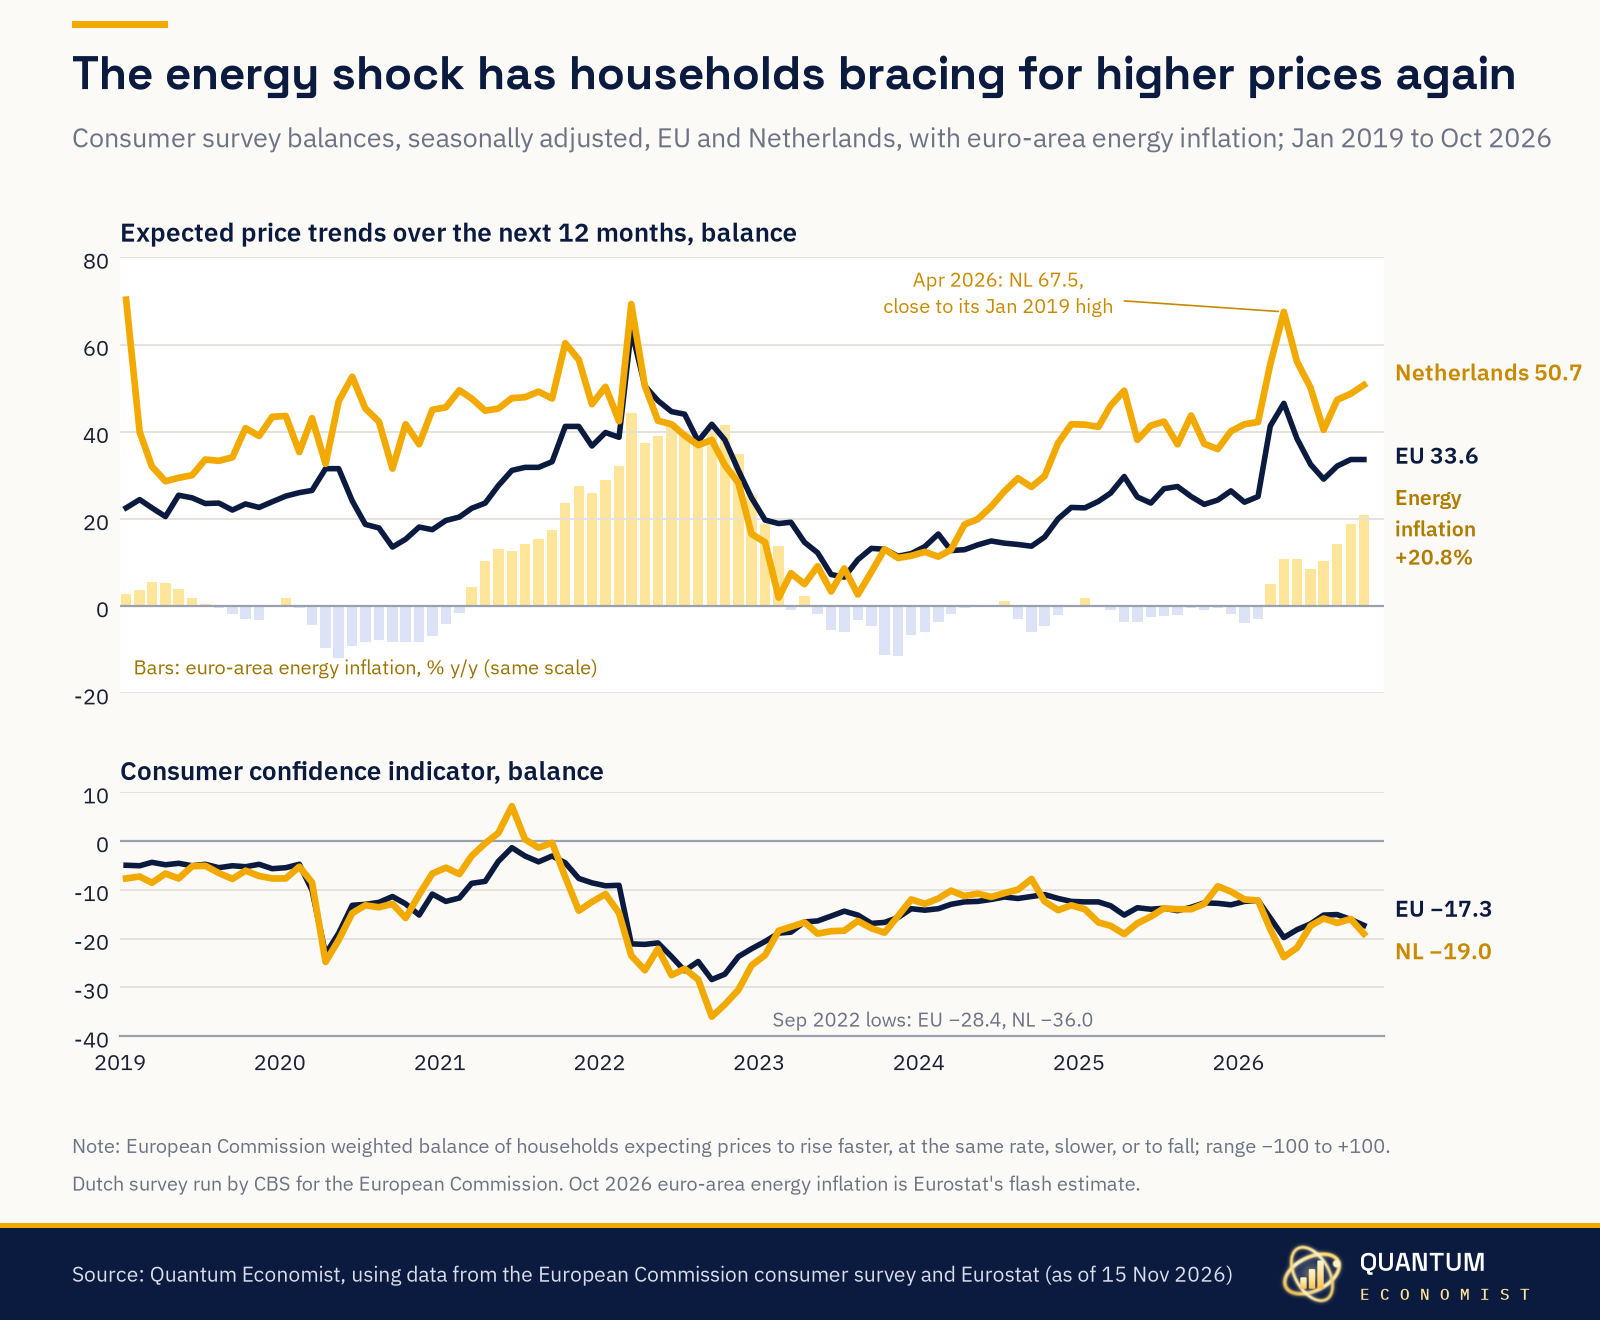
Dutch households' 12-month price expectations stand at 50.7, far above the EU's 33.6, as euro-area energy inflation runs at +20.8%. Consumer confidence has slipped back to −17.3 in the EU and −19.0 in the Netherlands, well above the 2022 lows but falling again.
· Source: Quantum Economist, using data from the European Commission (DG ECFIN) via Eurostat
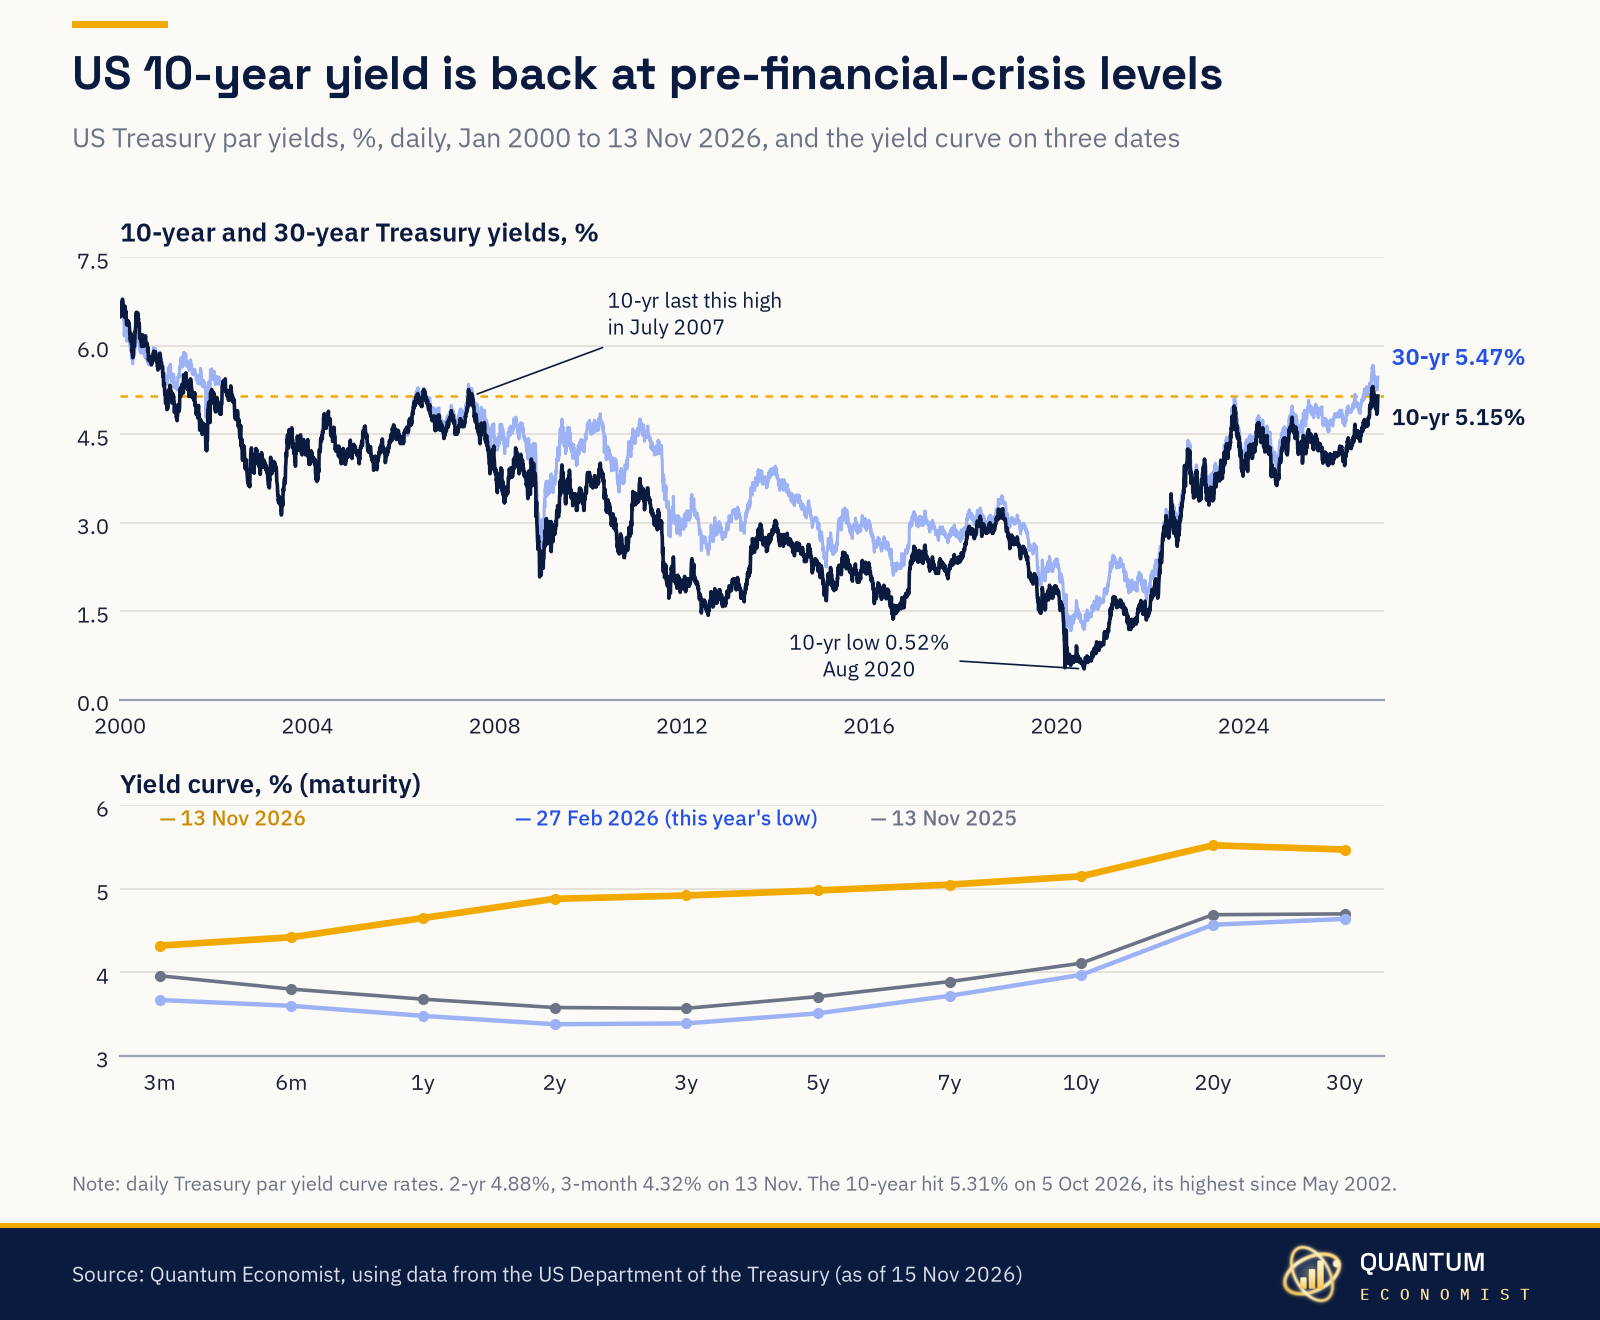
The 10-year Treasury yield closed at 5.15% on 13 November, up from 3.97% in February. Before this year it was last that high in July 2007. The 30-year yield is 5.47%, and every maturity from three months out now yields at least 4.3%.
· Source: Quantum Economist, using data from the US Department of the Treasury
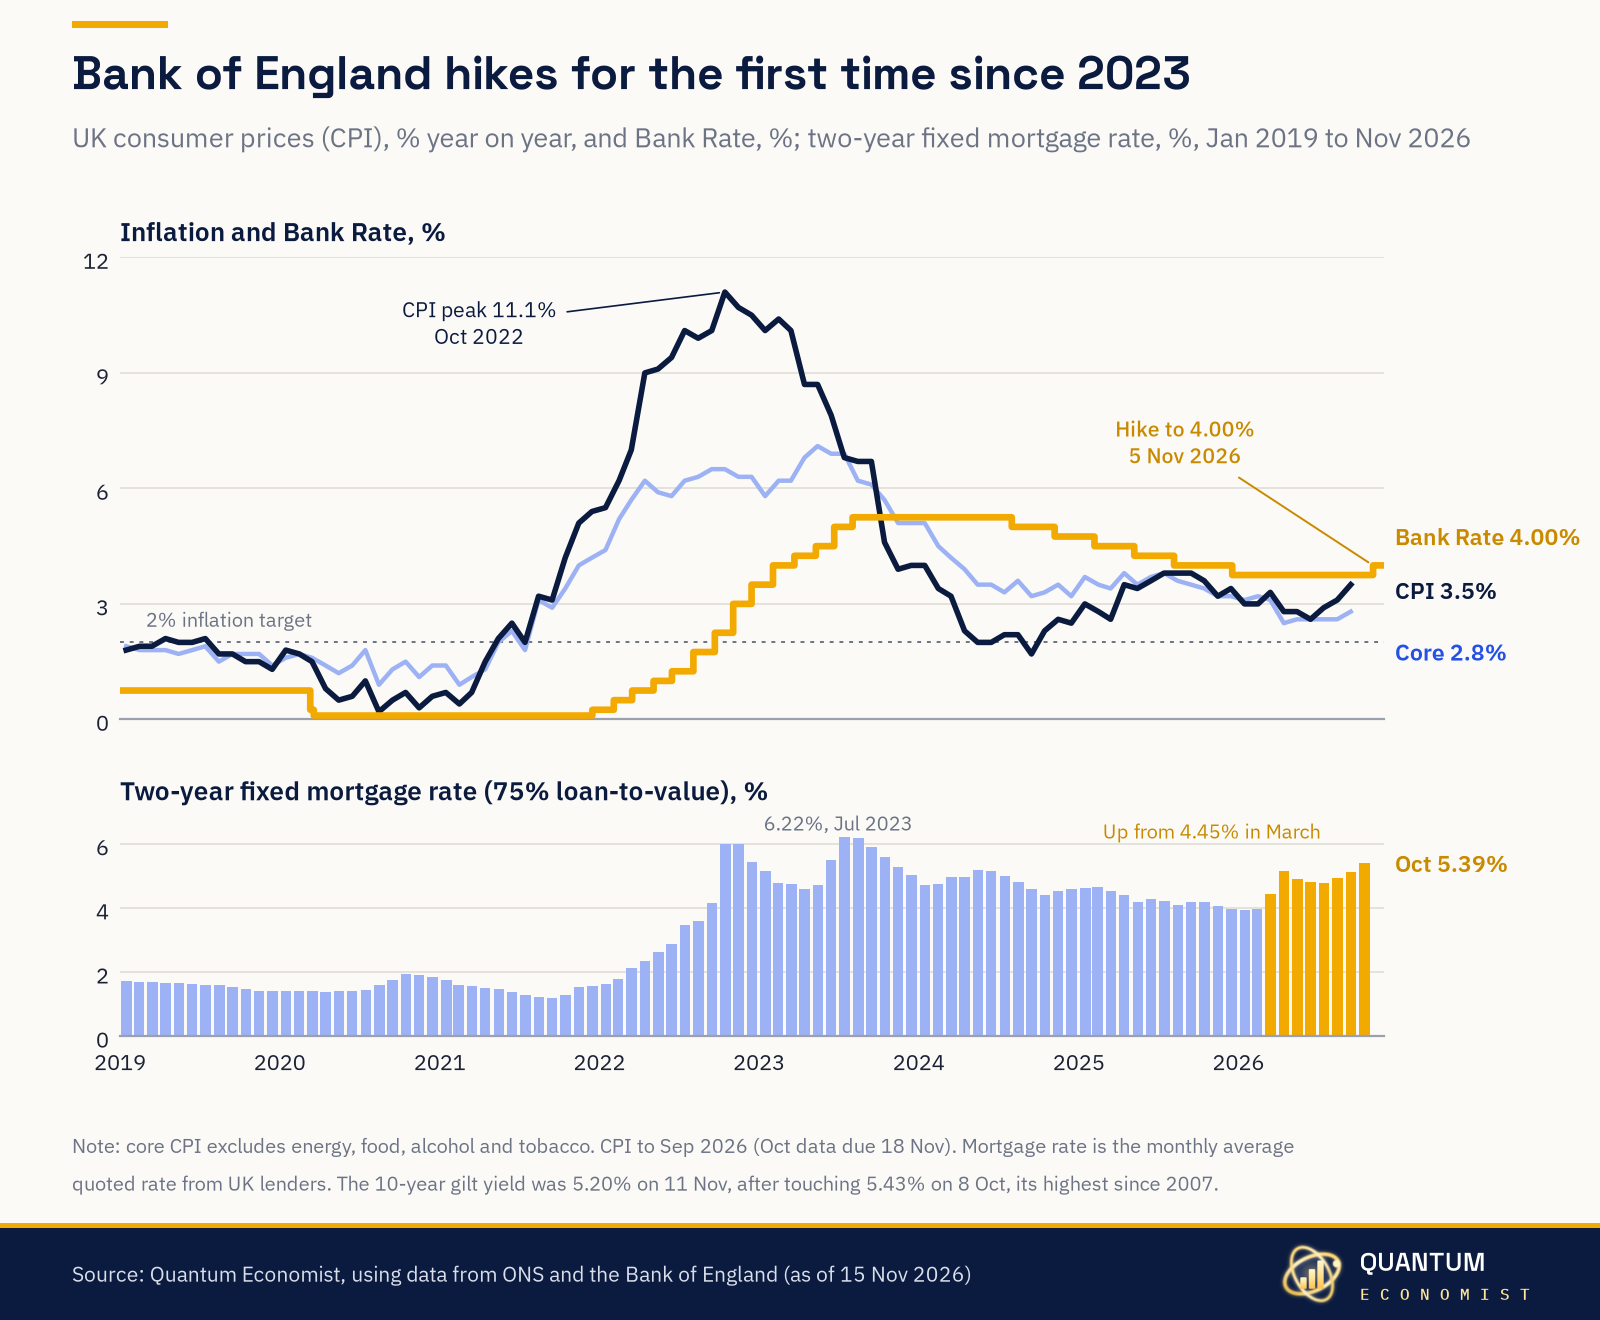
The Bank of England raised Bank Rate to 4.00% on 5 November, its first hike since August 2023, after CPI inflation climbed from 2.6% in June to 3.5% in September. Two-year fixed mortgage rates are back up to 5.39%, the highest since October 2023.
· Source: Quantum Economist, using data from ONS and the Bank of England
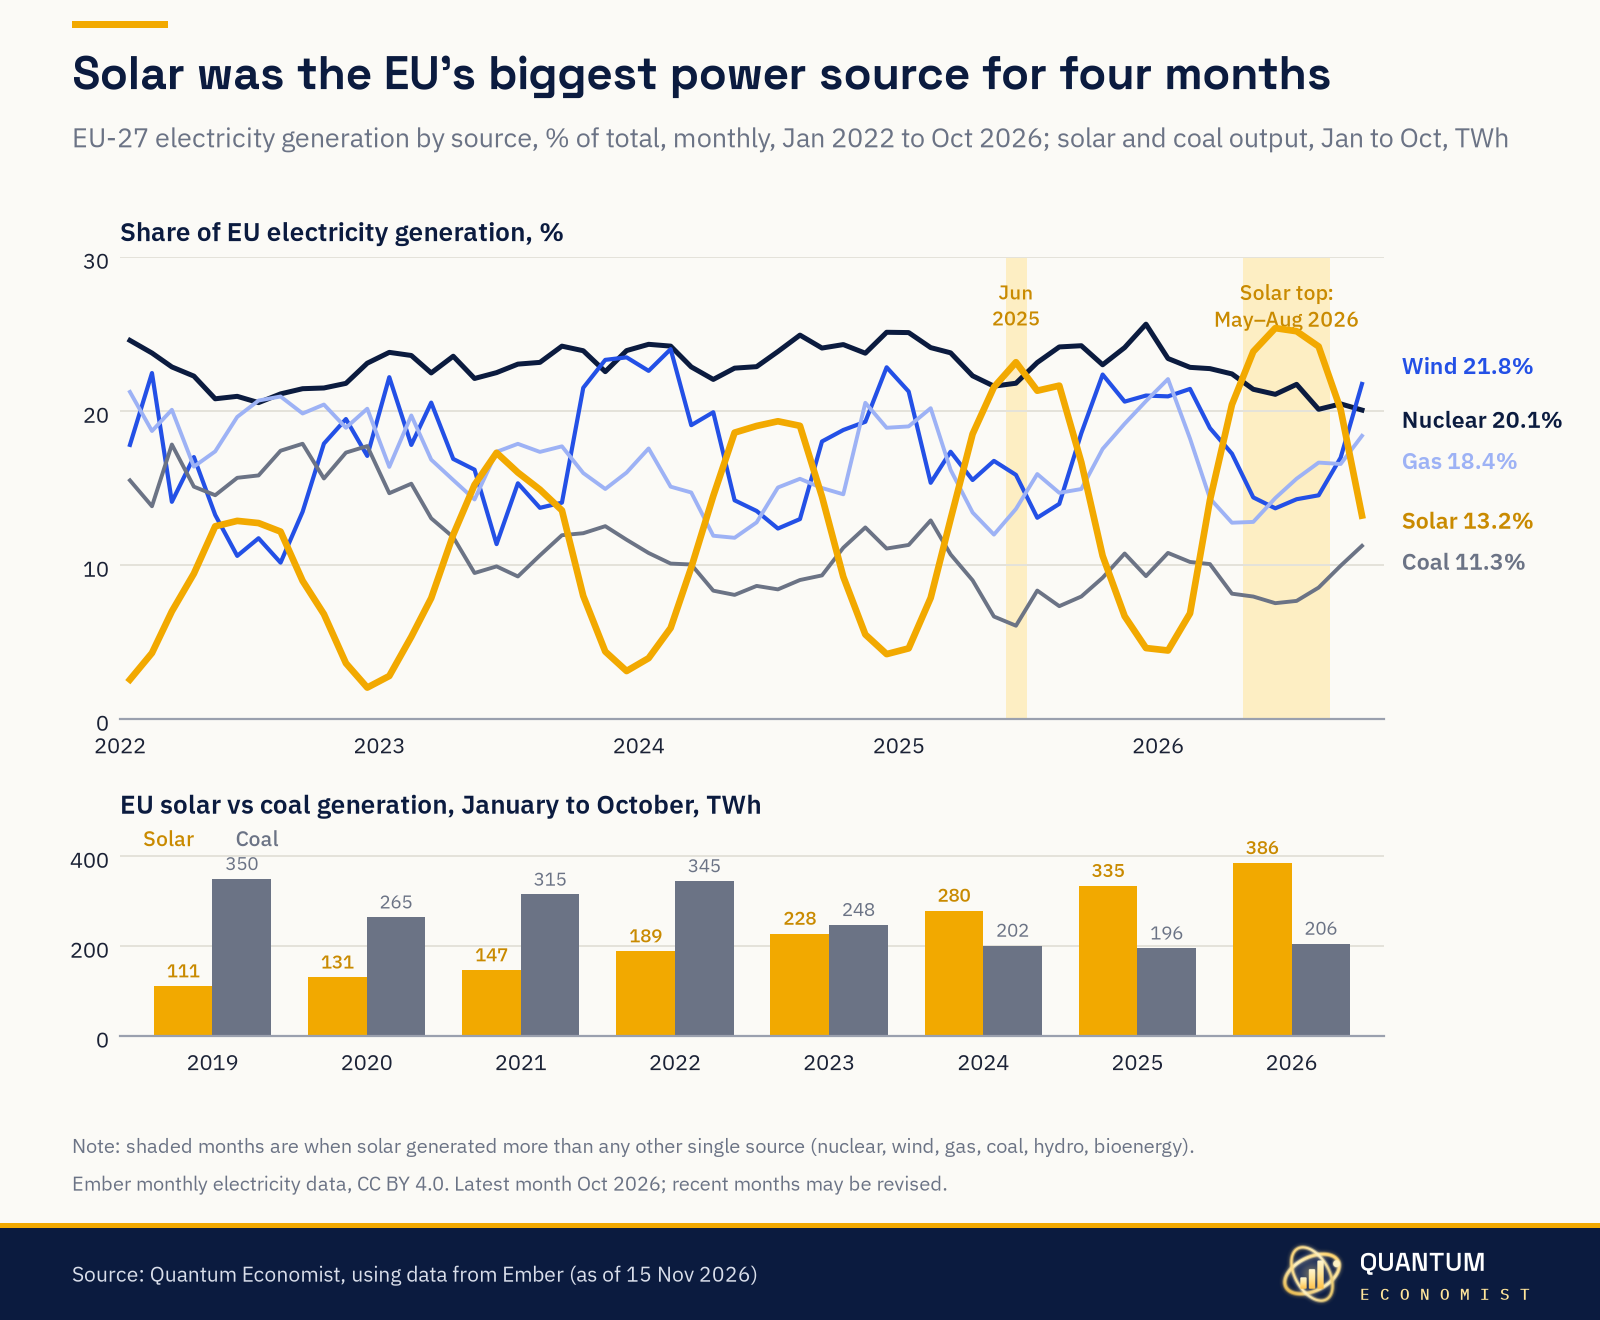
From May to August 2026, solar generated more EU electricity than any other single source, including nuclear. In 2025 that happened only in June. From January to October, solar produced 386 TWh, almost double coal's 206 TWh.
· Source: Quantum Economist, using data from Ember
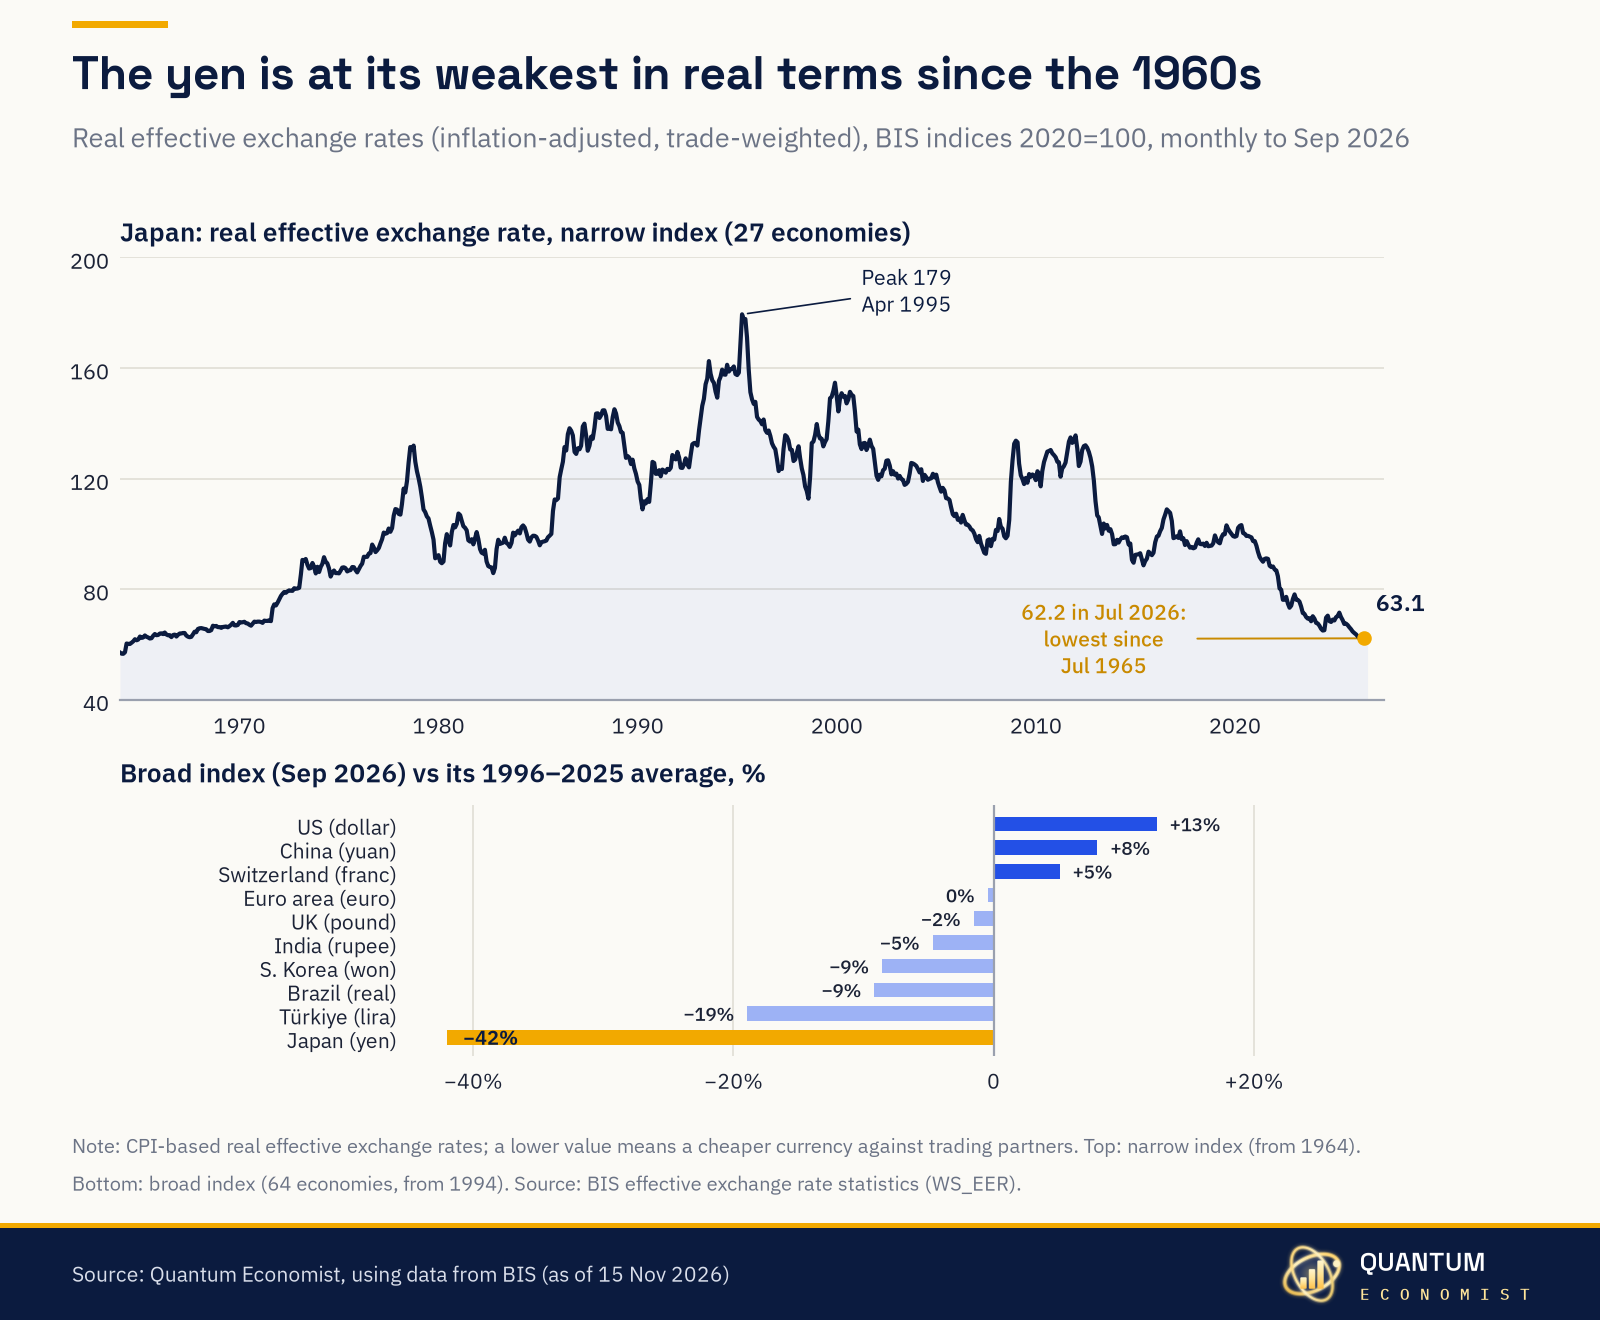
The BIS real effective exchange rate for the yen fell to 62.2 in July, its lowest since 1965 and 65% below its 1995 peak. On the broad index, the yen is 42% below its 1996–2025 average, while the dollar is 13% above its own.
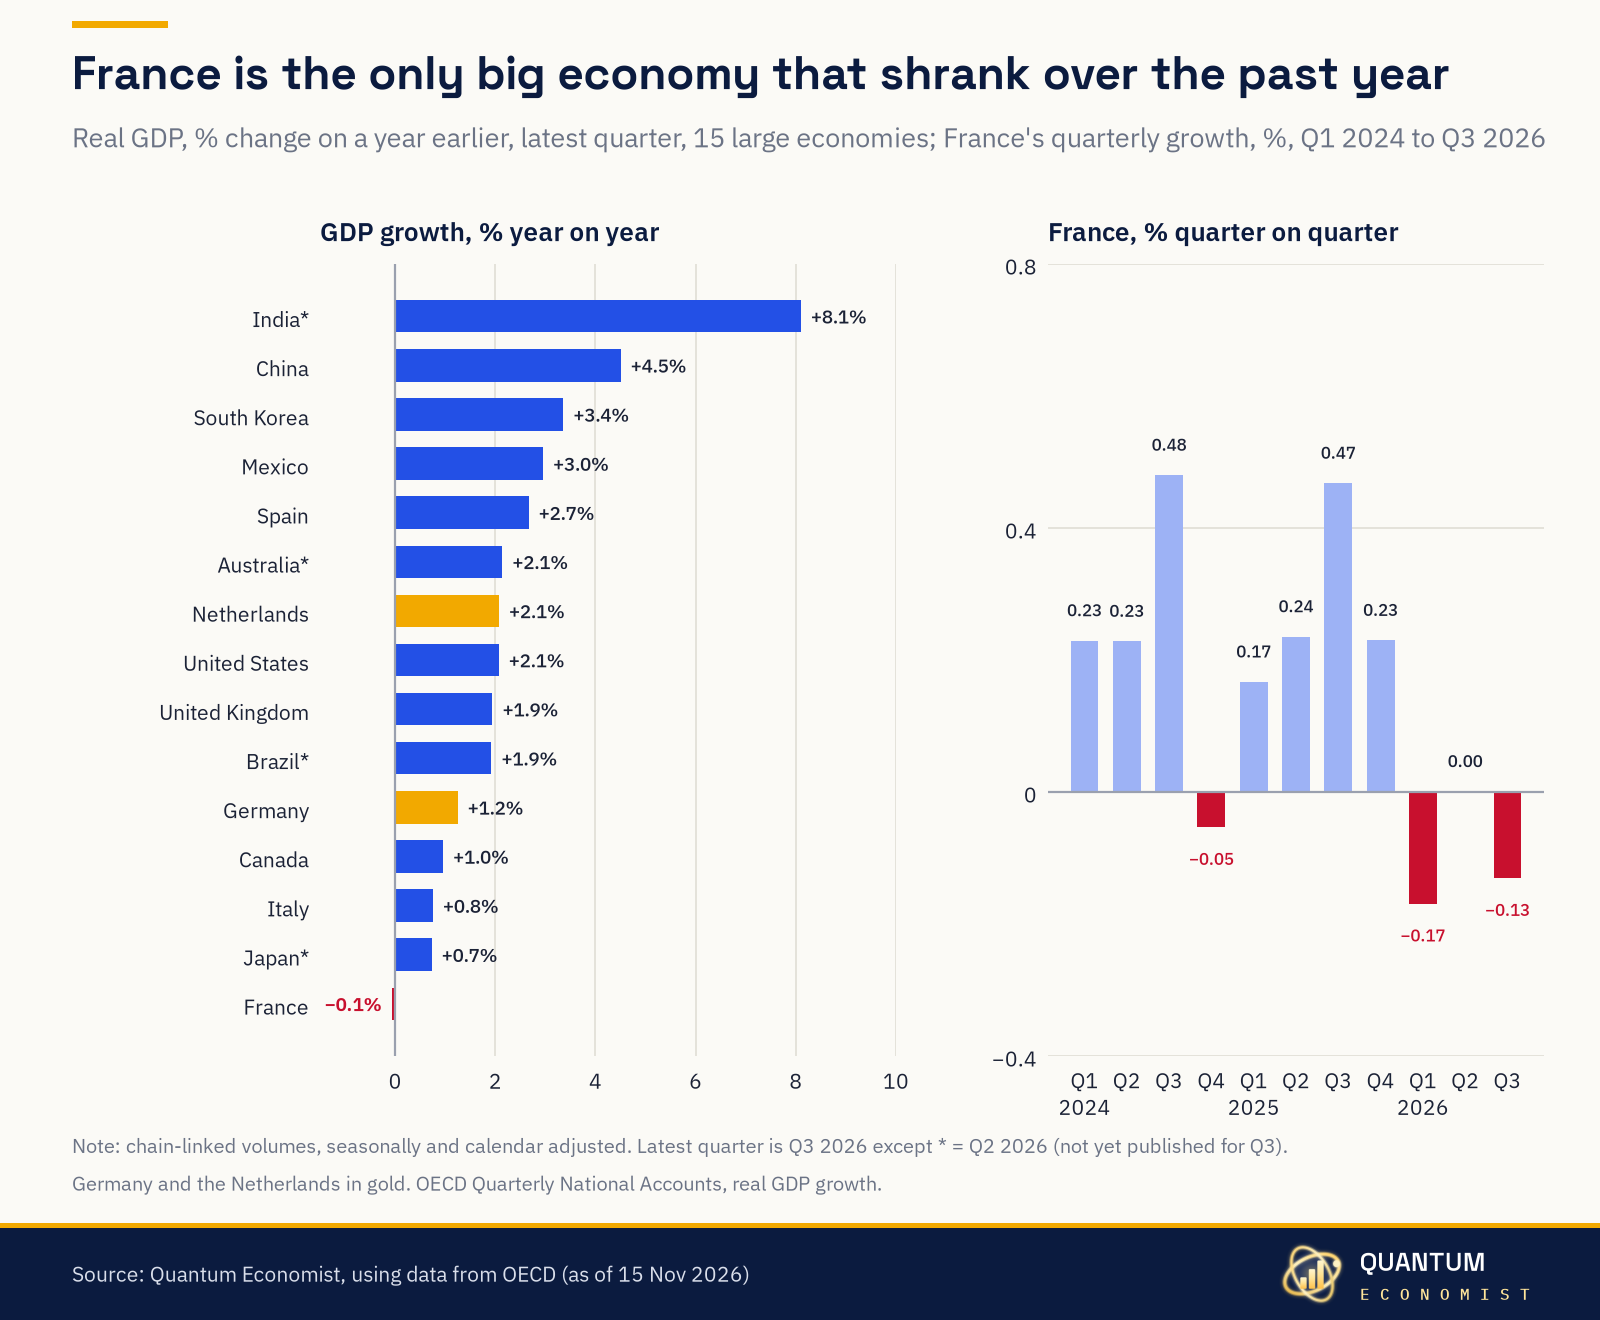
French real GDP was 0.07% lower in Q3 2026 than a year earlier, the only fall among 15 large economies. Output fell 0.17% in Q1, was flat in Q2 and fell 0.13% in Q3, while Spain grew 2.7% and the US 2.1% over the year.
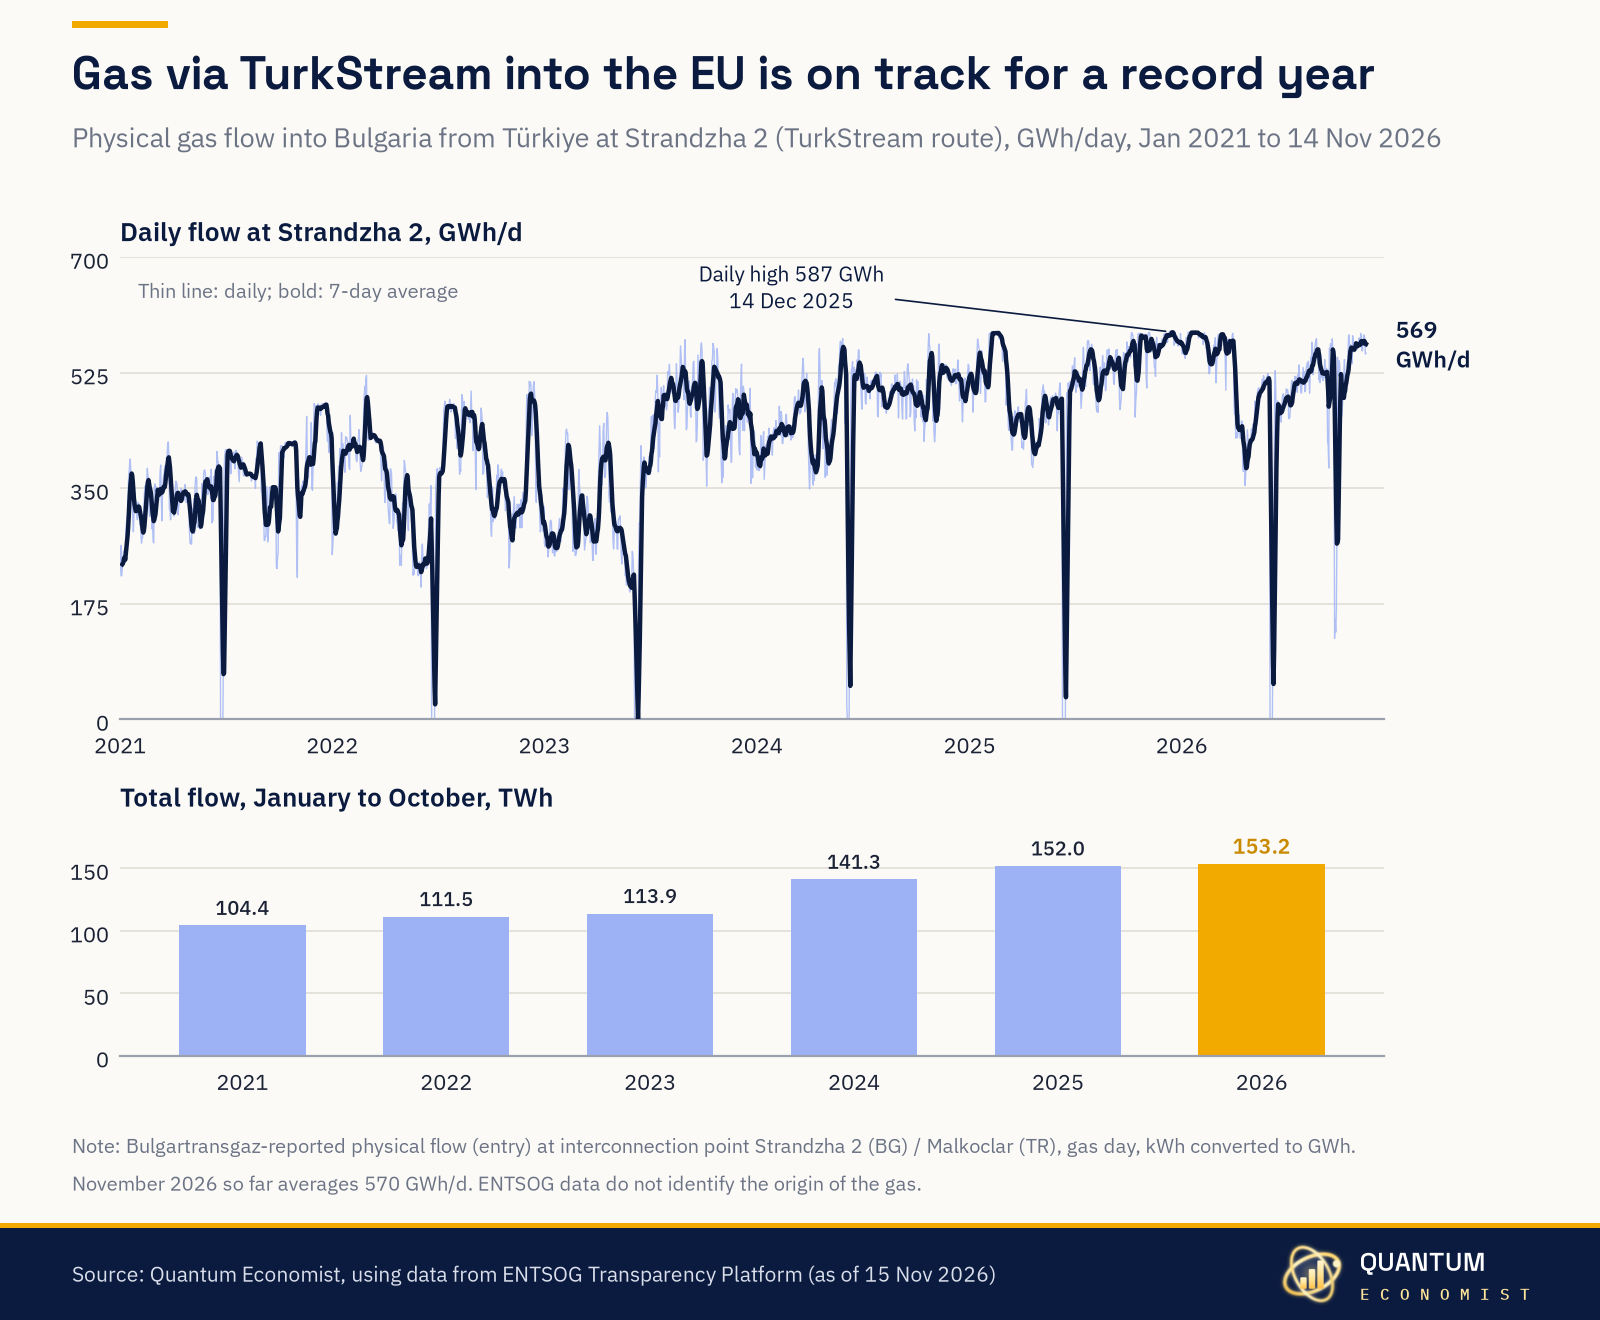
From January to October, 153.2 TWh of gas entered Bulgaria from Türkiye at Strandzha 2, the TurkStream route into the EU. That is the most for the period since the data begin in 2021. November flows average 570 GWh a day, close to the record of 587 GWh set in December 2025.
· Source: Quantum Economist, using data from ENTSOG Transparency Platform
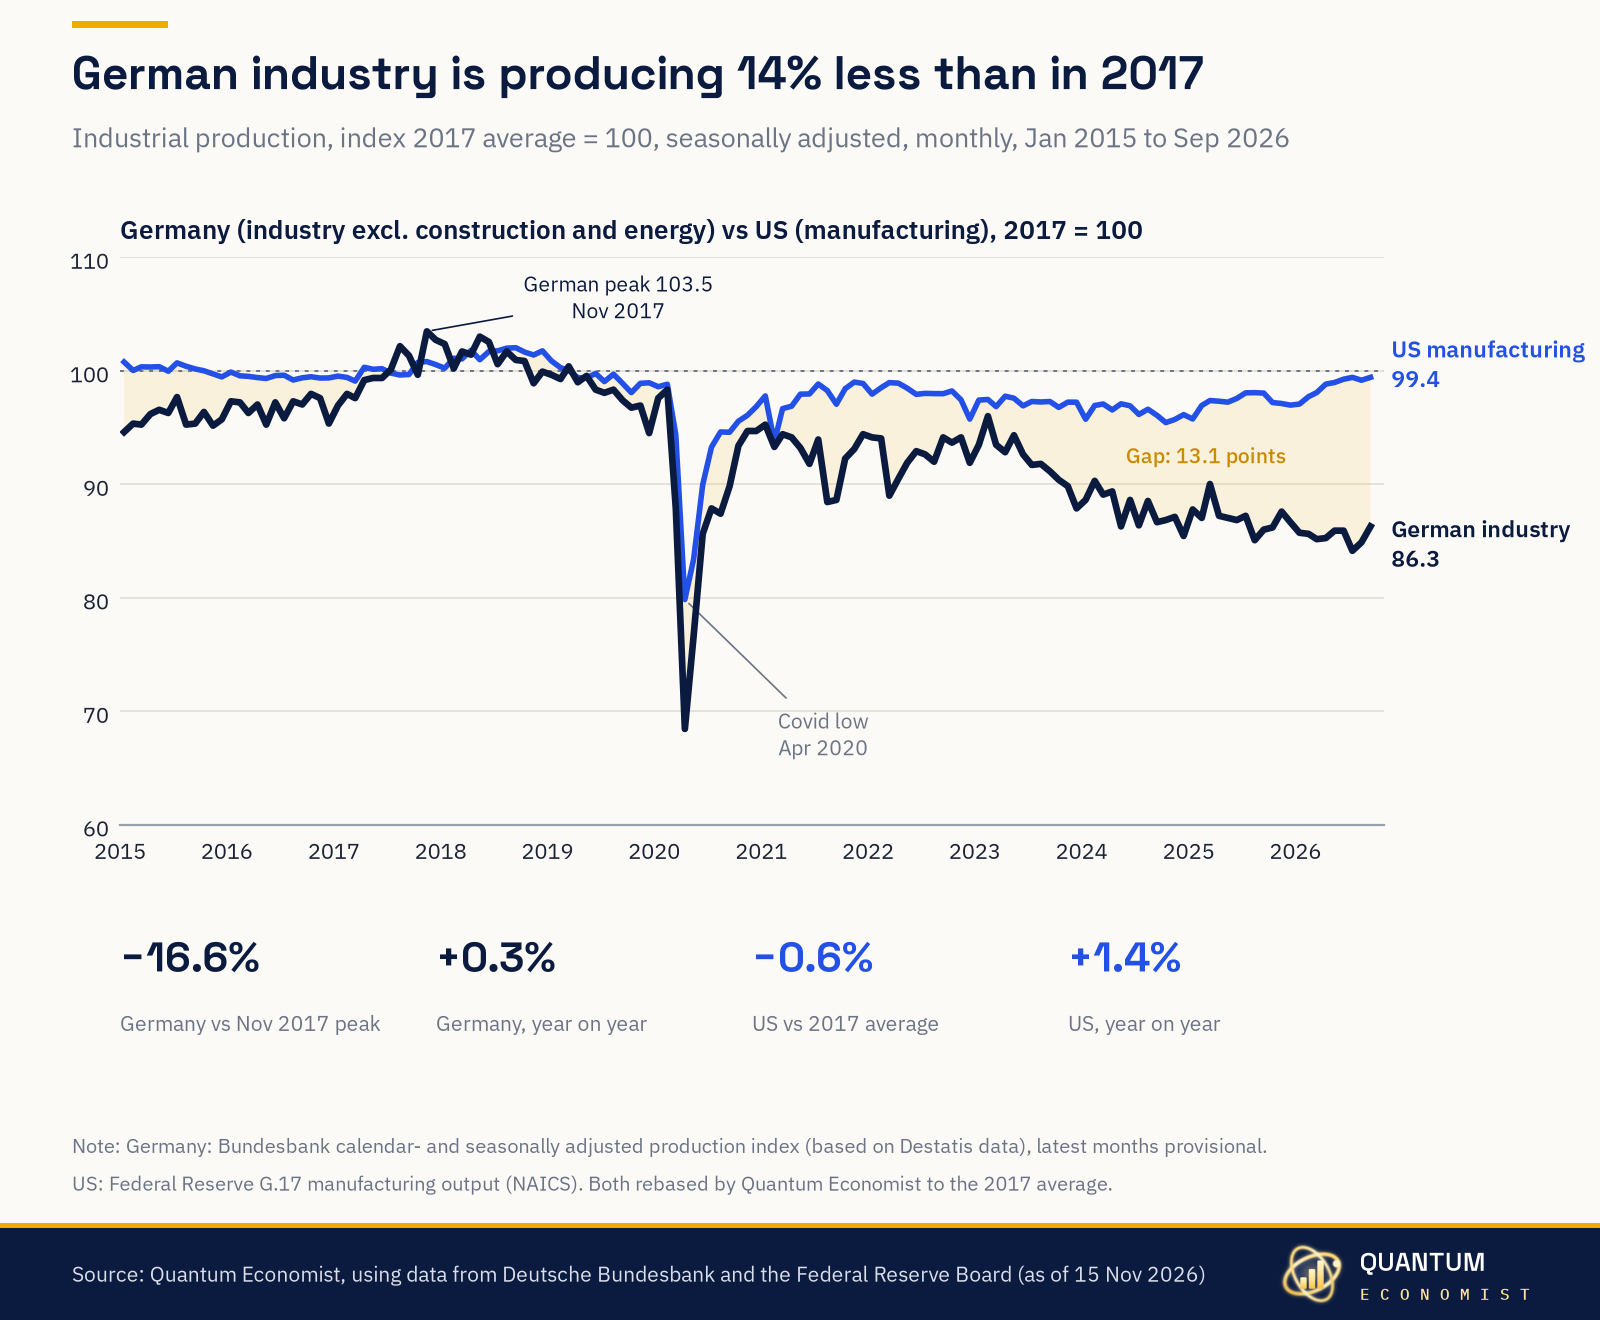
German industrial output in September was 13.7% below its 2017 average and 16.6% below its November 2017 peak. US manufacturing is back to within 0.6% of its 2017 level.
· Source: Quantum Economist, using data from Deutsche Bundesbank and the Federal Reserve Board
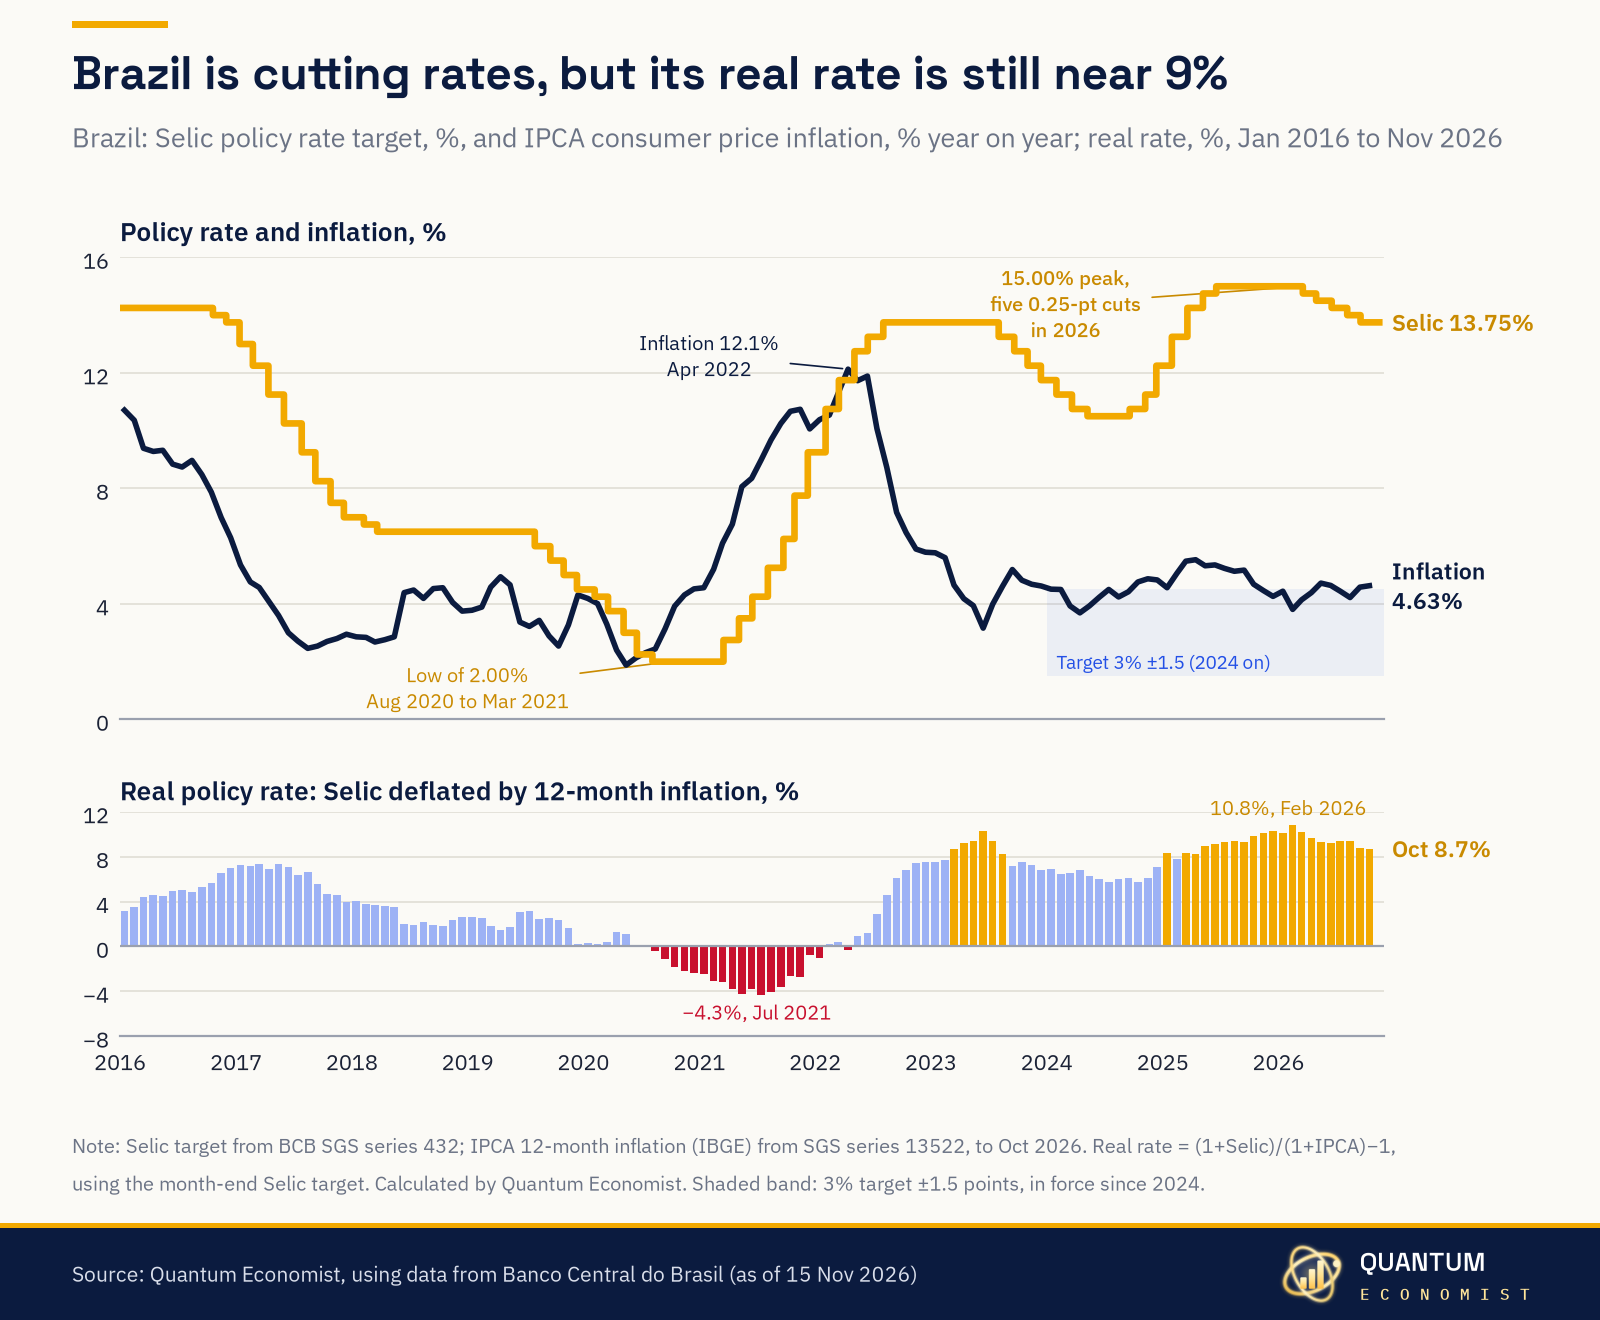
Brazil's central bank has cut the Selic five times this year, from 15.00% to 13.75%. With inflation at 4.63% in October, the real policy rate is still 8.7%, only a little below February's peak of 10.8%.
· Source: Quantum Economist, using data from Banco Central do Brasil
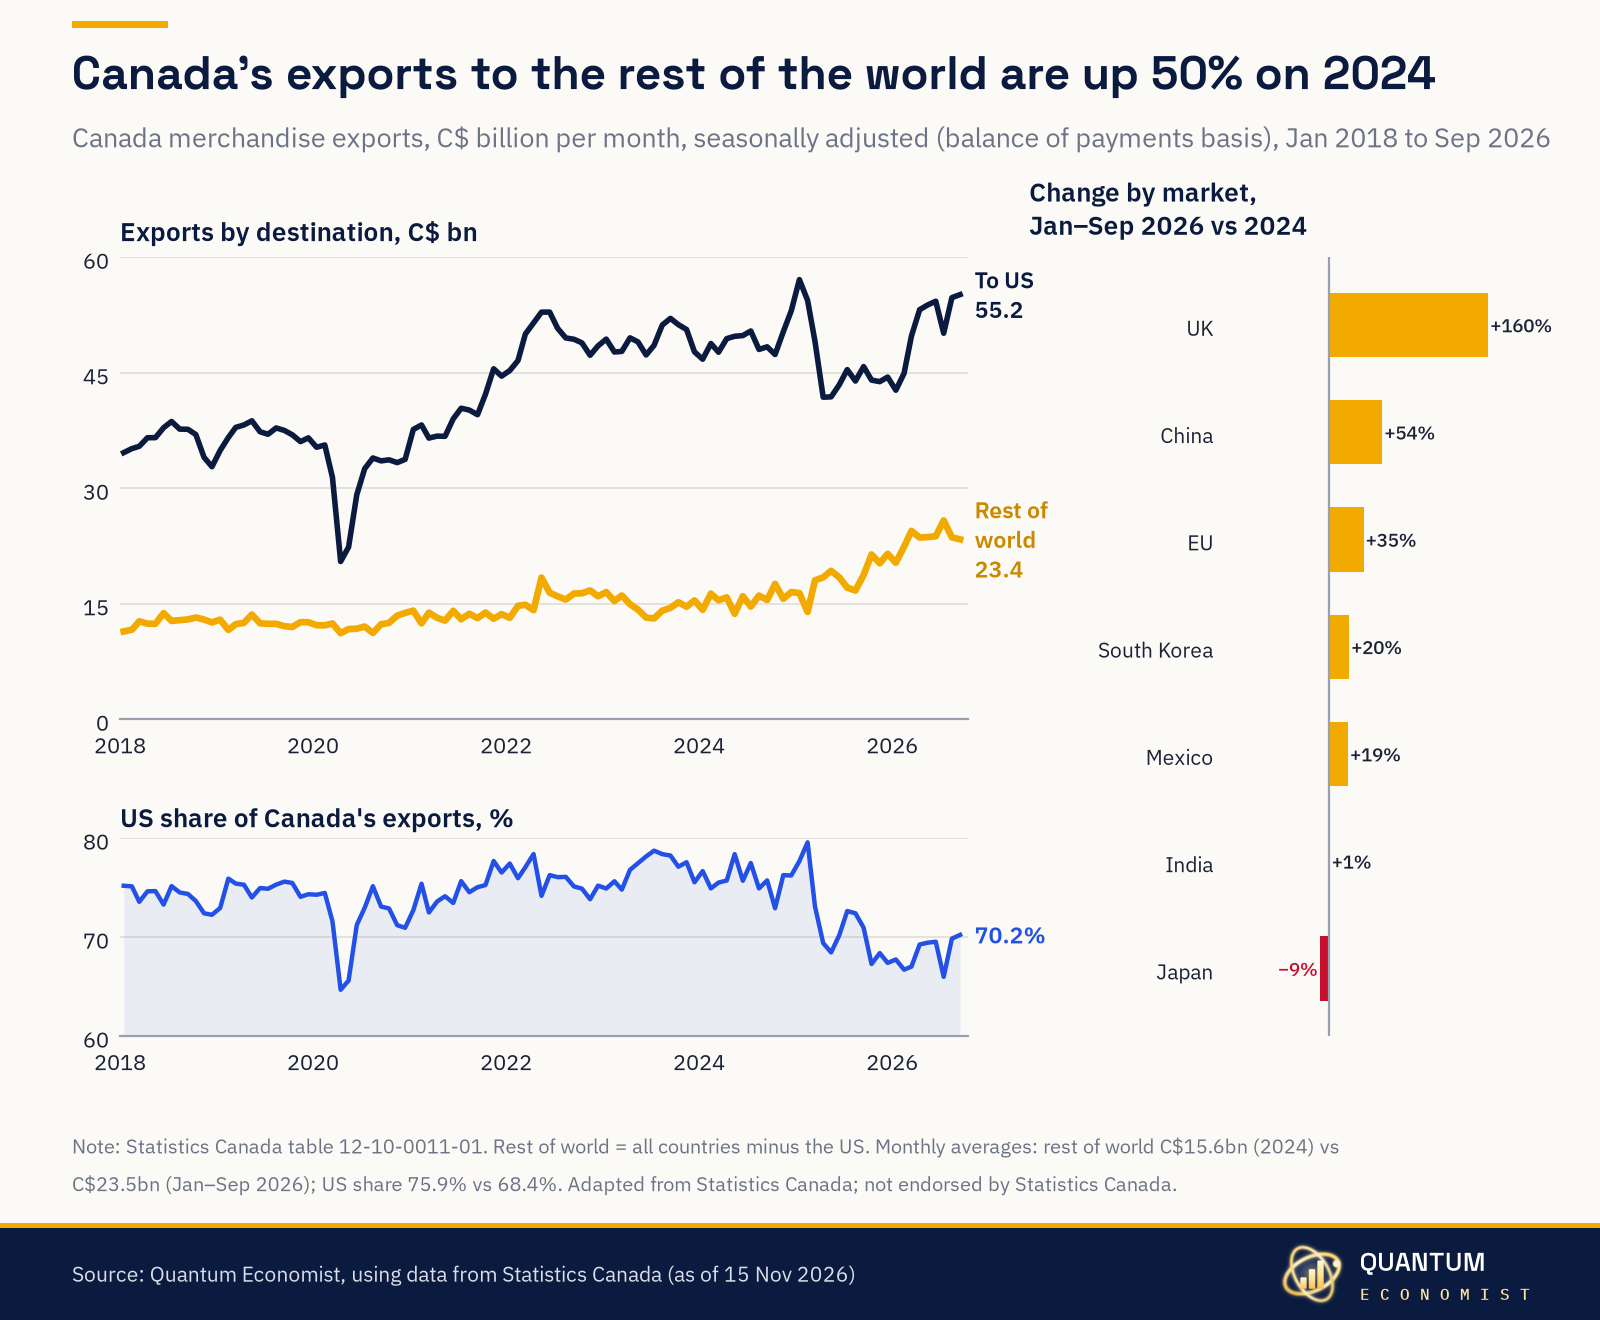
Canada's monthly exports outside the US averaged C$23.5bn from January to September, against C$15.6bn in 2024, and the US share fell from 75.9% to 68.4%. Exports to the UK rose 160%, to China 54% and to the EU 35%.
· Source: Quantum Economist, using data from Statistics Canada
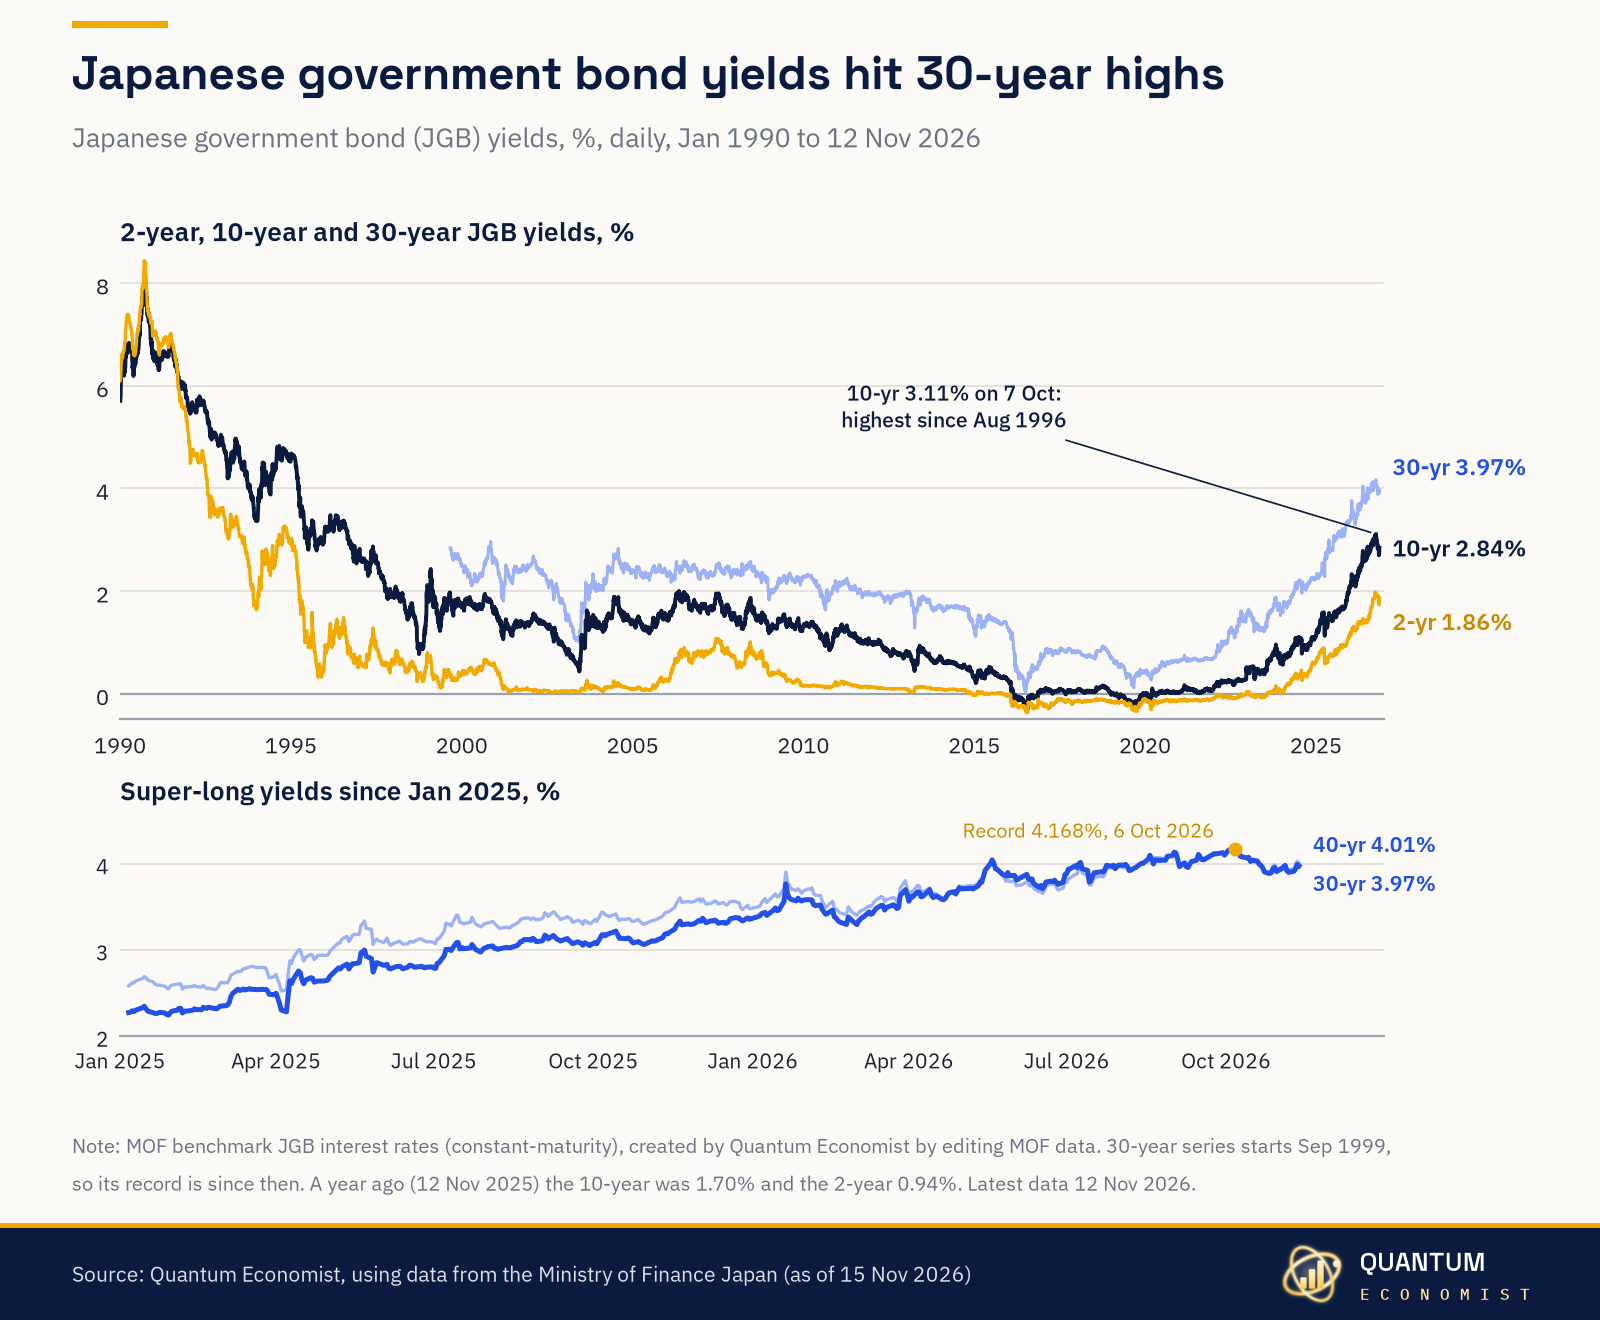
Japan's 10-year yield hit 3.11% on 7 October, its highest since August 1996, and was 2.84% on 12 November, against 1.70% a year earlier. The 30-year yield set a record of 4.17% in October, and the 40-year is now above 4%.
· Source: Quantum Economist, using data from the Ministry of Finance Japan
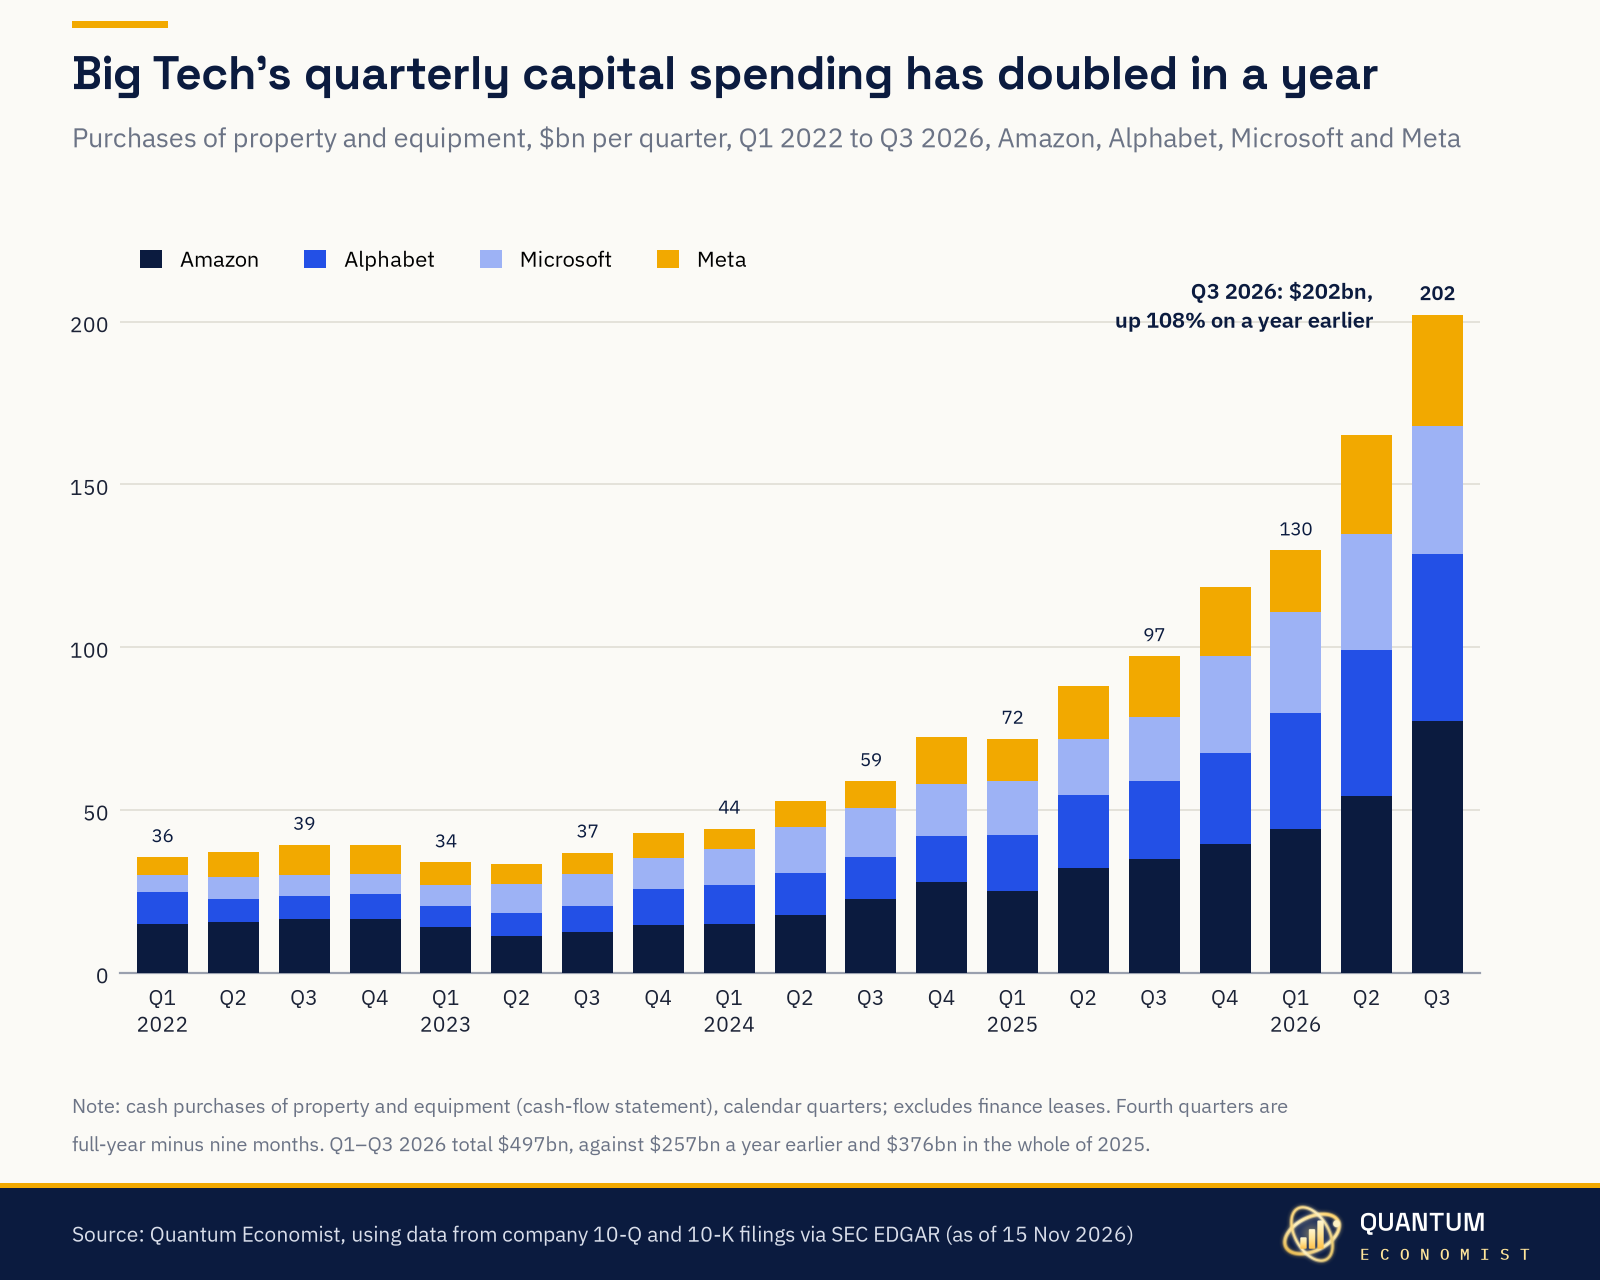
Amazon, Alphabet, Microsoft and Meta spent a combined $202bn on property and equipment in Q3 2026, 108% more than the $97bn of Q3 2025. Their total for the first nine months of 2026, $497bn, already exceeds the $376bn they spent in the whole of 2025. Amazon spent the most in Q3 ($77.3bn), ahead of Alphabet ($51.4bn), Microsoft ($39.4bn) and Meta ($33.9bn).
· Source: Quantum Economist, using data from company 10-Q and 10-K filings (SEC EDGAR)
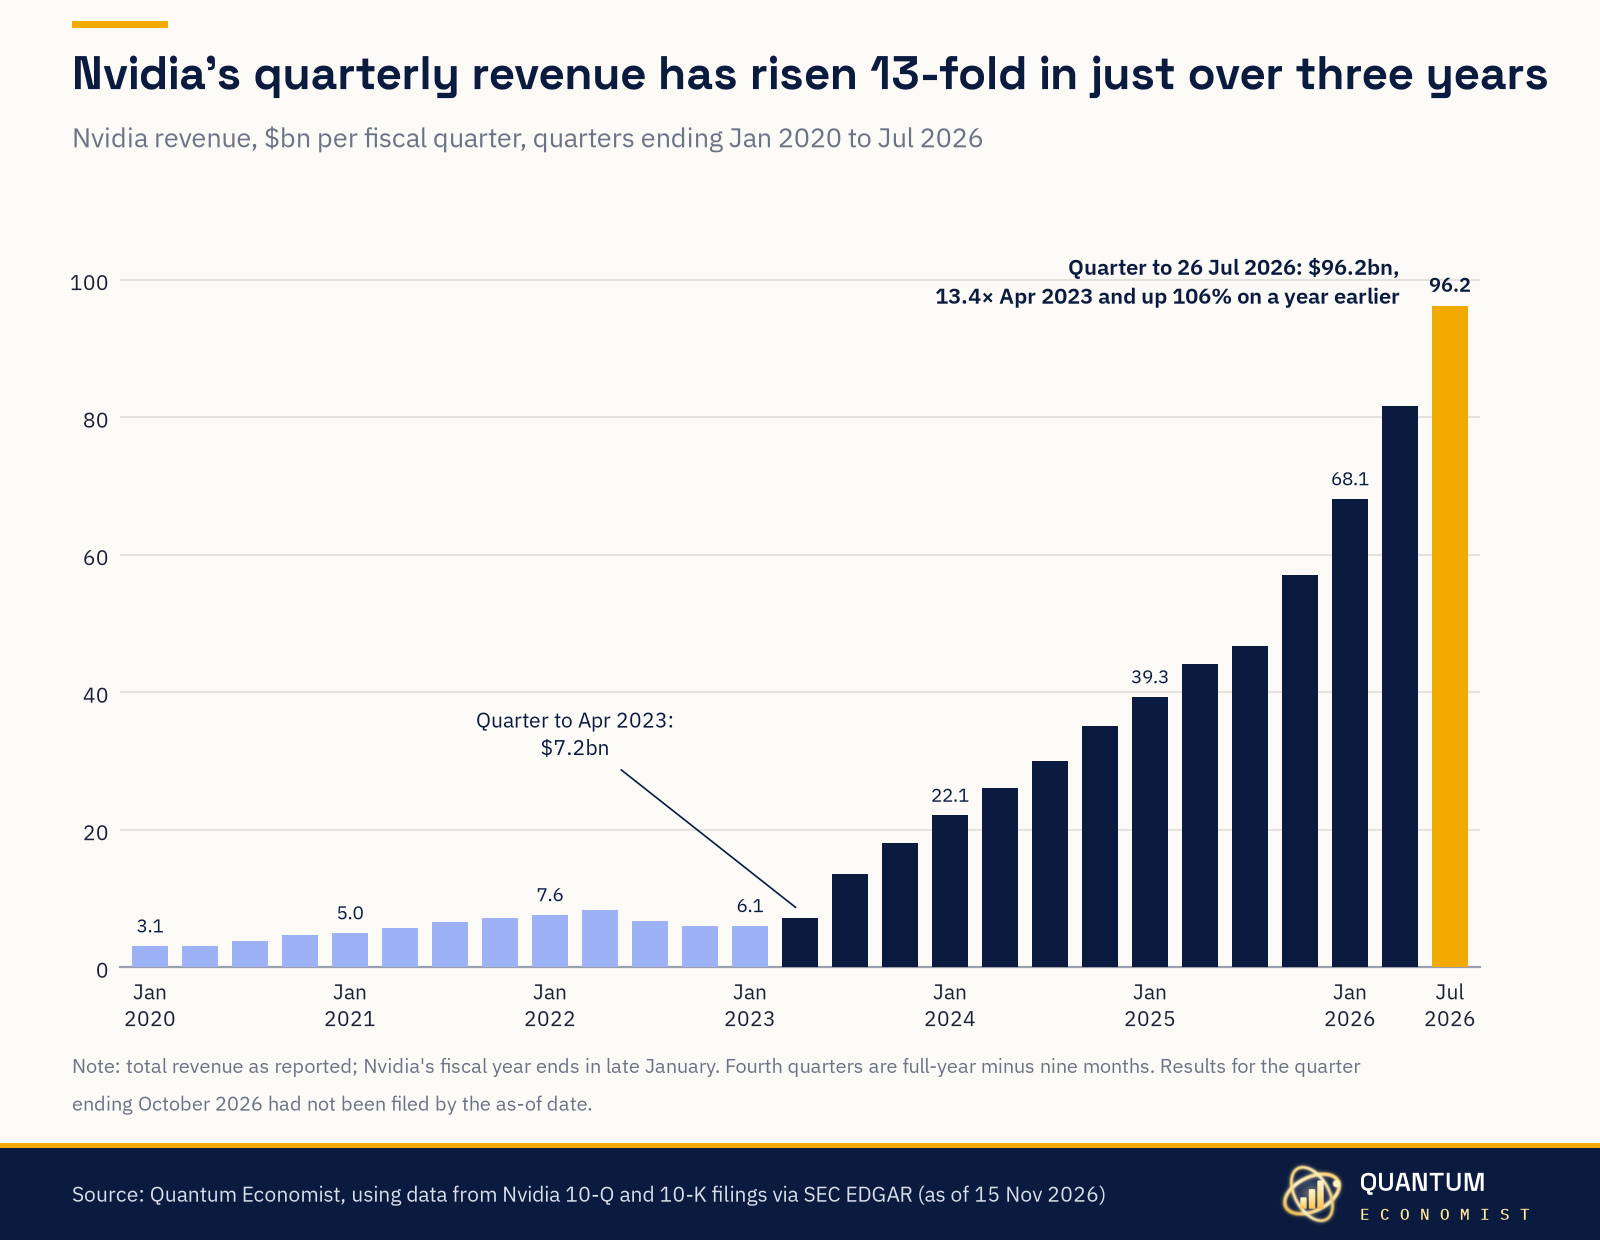
Nvidia's revenue reached $96.2bn in the quarter to 26 July 2026, 13.4 times the $7.2bn of the quarter to April 2023 and 106% more than a year earlier. Results for the quarter to October 2026 had not been filed by 15 November.
· Source: Quantum Economist, using data from Nvidia 10-Q and 10-K filings (SEC EDGAR)
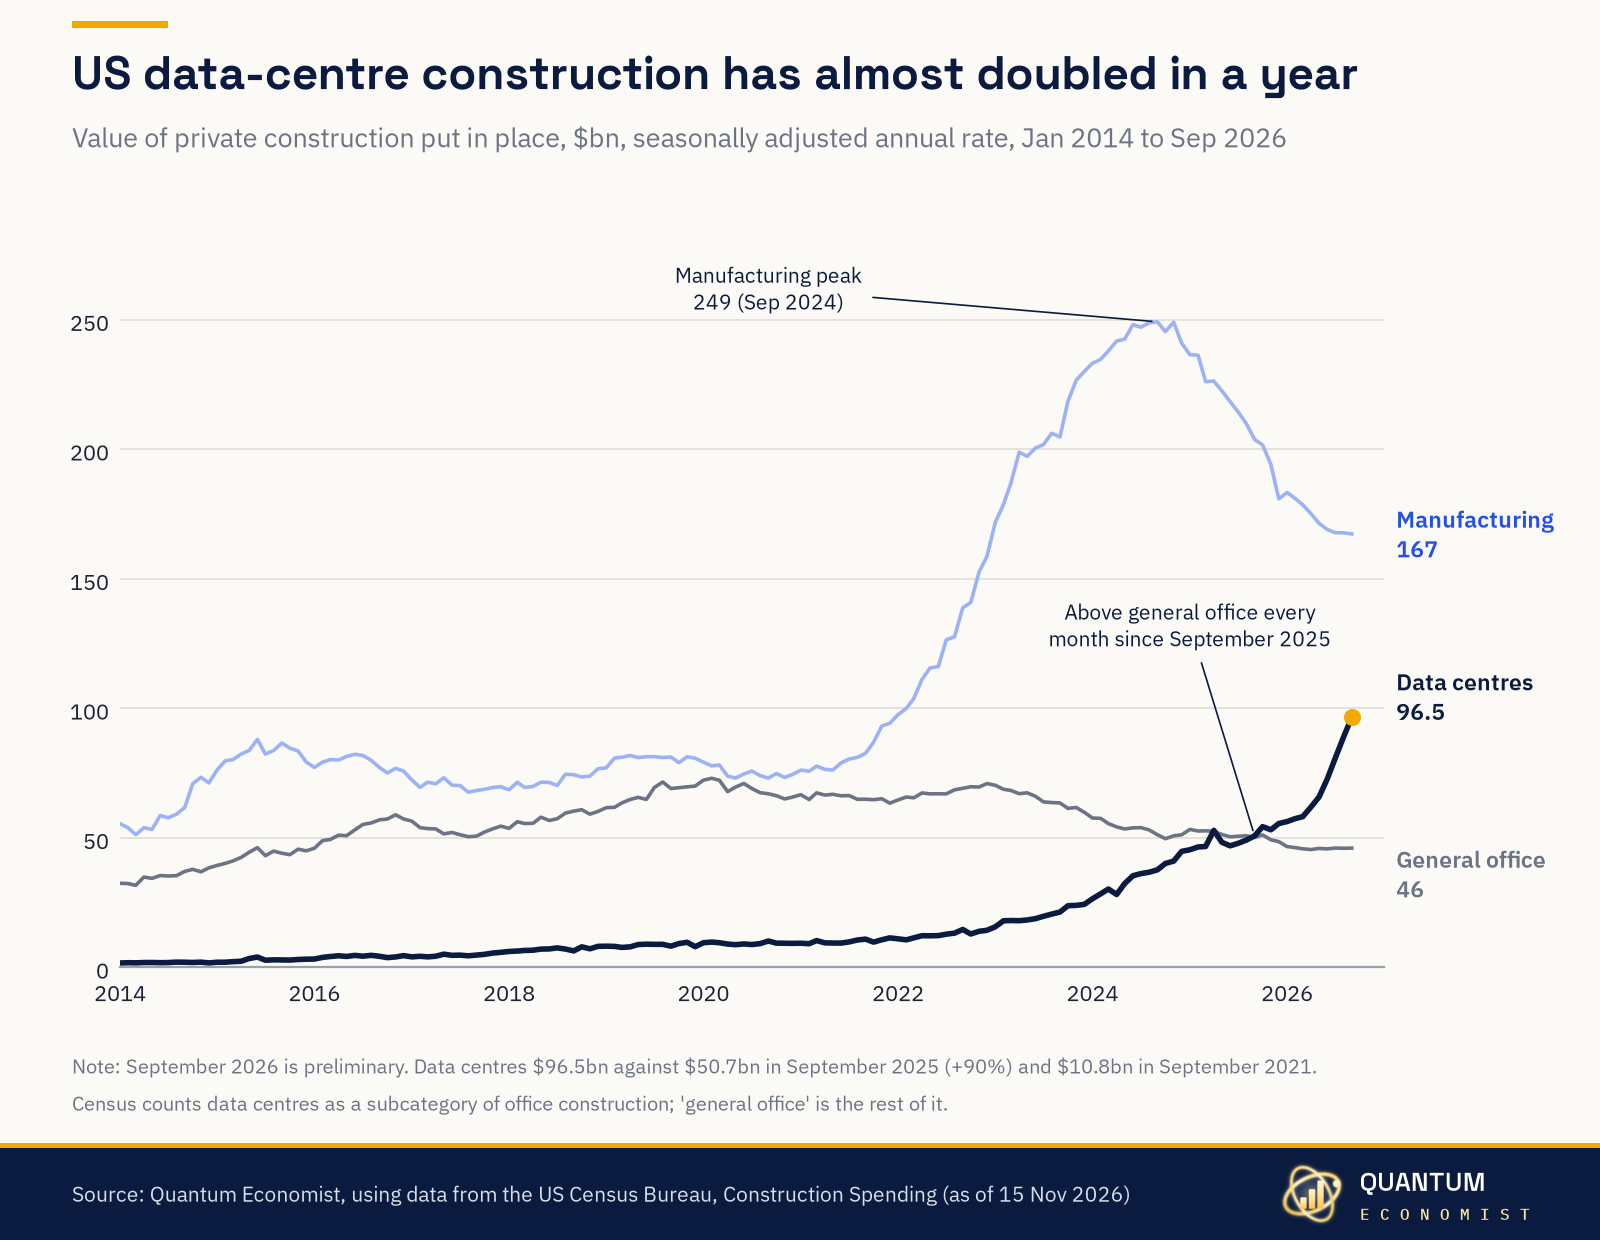
Spending on US data-centre construction ran at an annual rate of $96.5bn in September 2026, up 90% from $50.7bn a year earlier and almost nine times the $10.8bn of September 2021. It has exceeded general office construction every month since September 2025, while factory construction has fallen from a $249bn peak in September 2024 to $167bn.
· Source: Quantum Economist, using data from the US Census Bureau
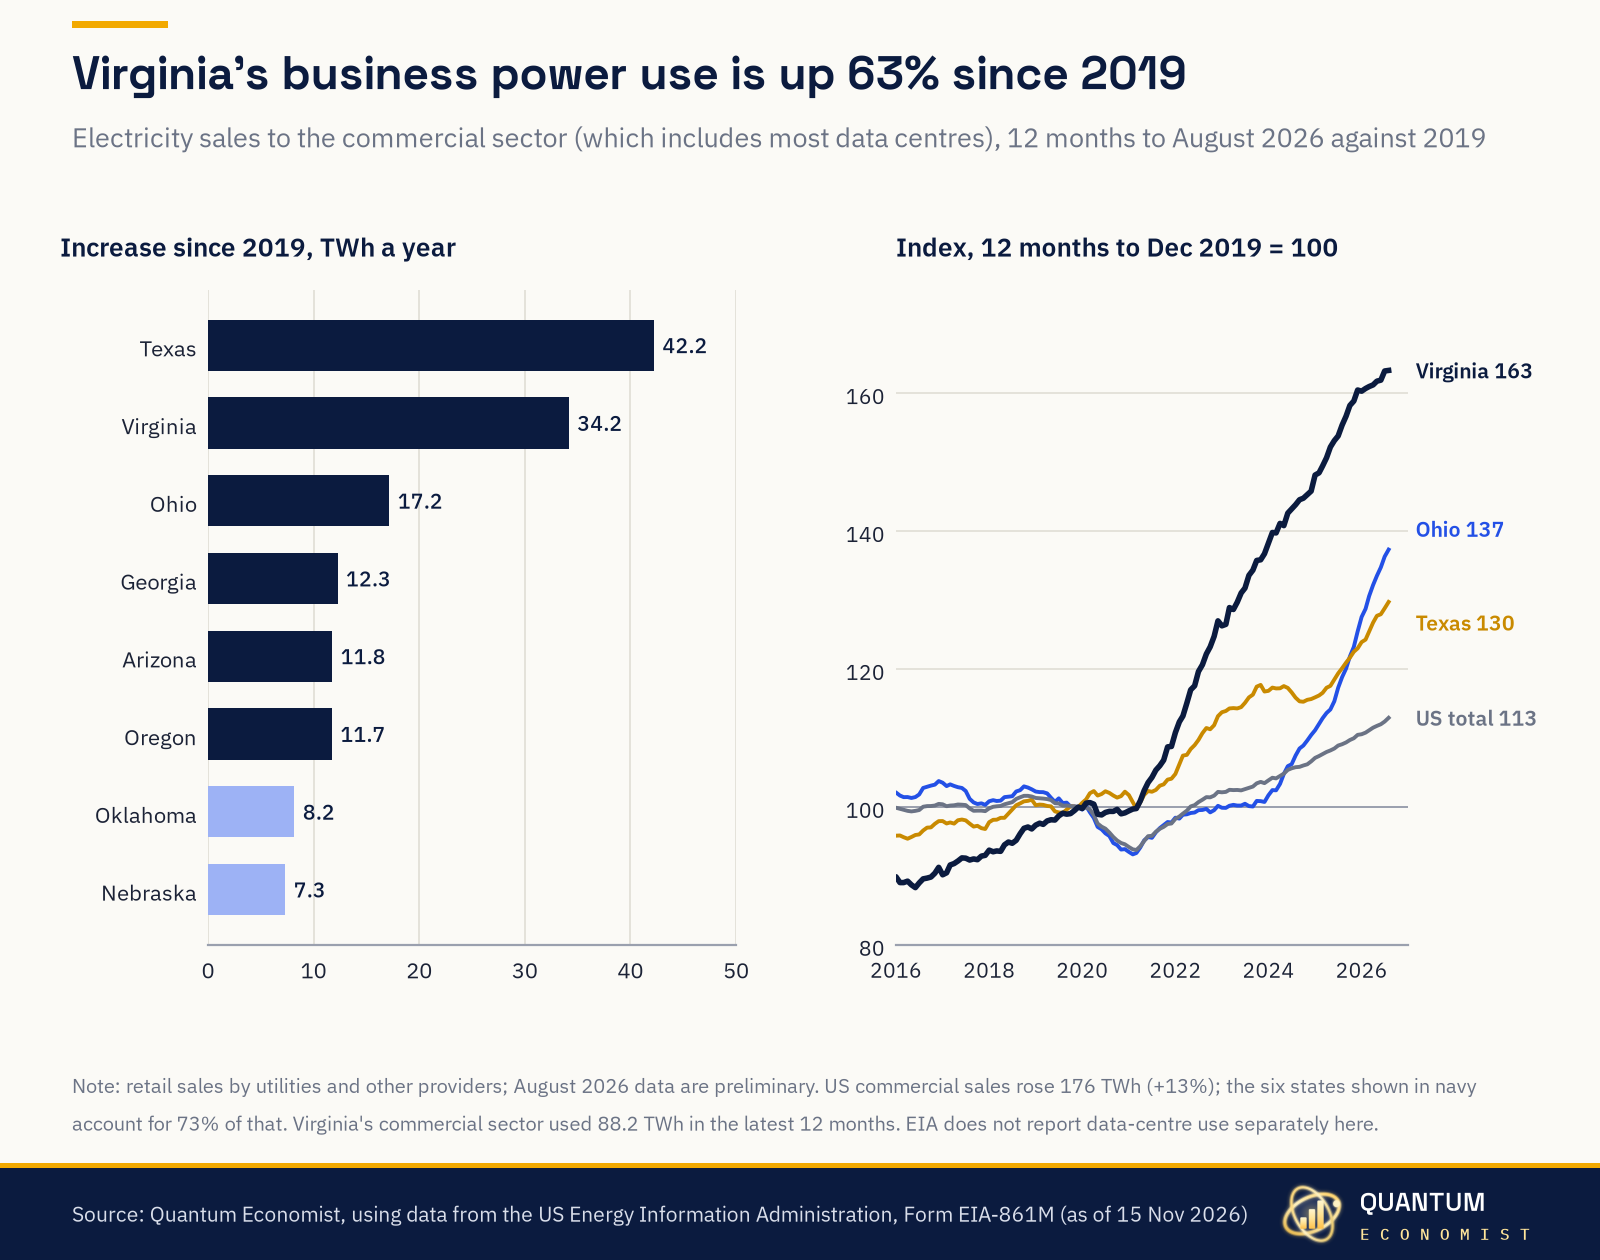
Electricity sales to Virginia's commercial sector, which includes most data centres, reached 88.2 TWh in the 12 months to August 2026, 63% more than in 2019. US commercial sales rose 13% over the same period, and six states (Texas, Virginia, Ohio, Georgia, Arizona and Oregon) account for 73% of that increase.
· Source: Quantum Economist, using data from the US Energy Information Administration
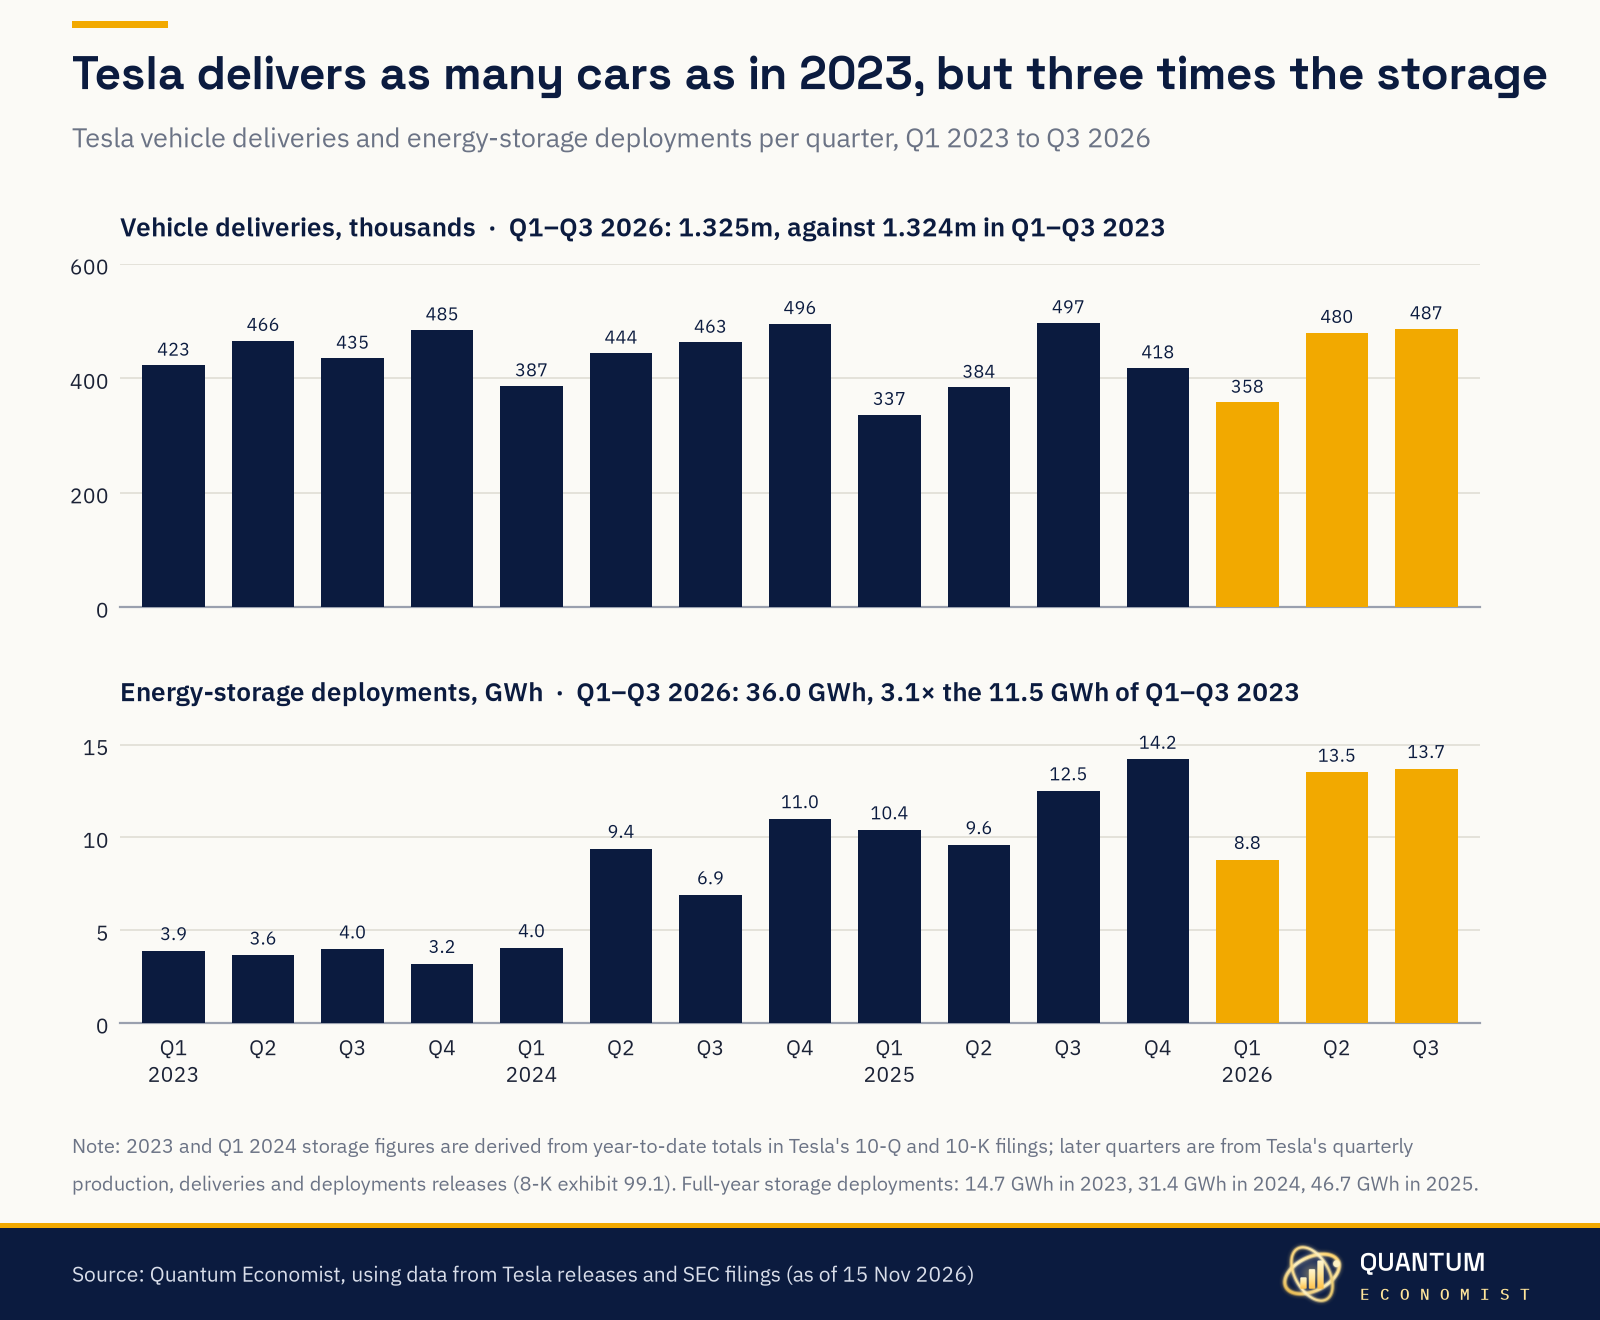
Tesla delivered 1.325 million vehicles in the first three quarters of 2026, almost exactly the 1.324 million of the same period in 2023. Its energy-storage deployments reached 36.0 GWh, 3.1 times the 11.5 GWh of the first three quarters of 2023. In Q3 2026 it delivered 486,532 vehicles and deployed 13.7 GWh of storage.
· Source: Quantum Economist, using data from Tesla releases and SEC filings
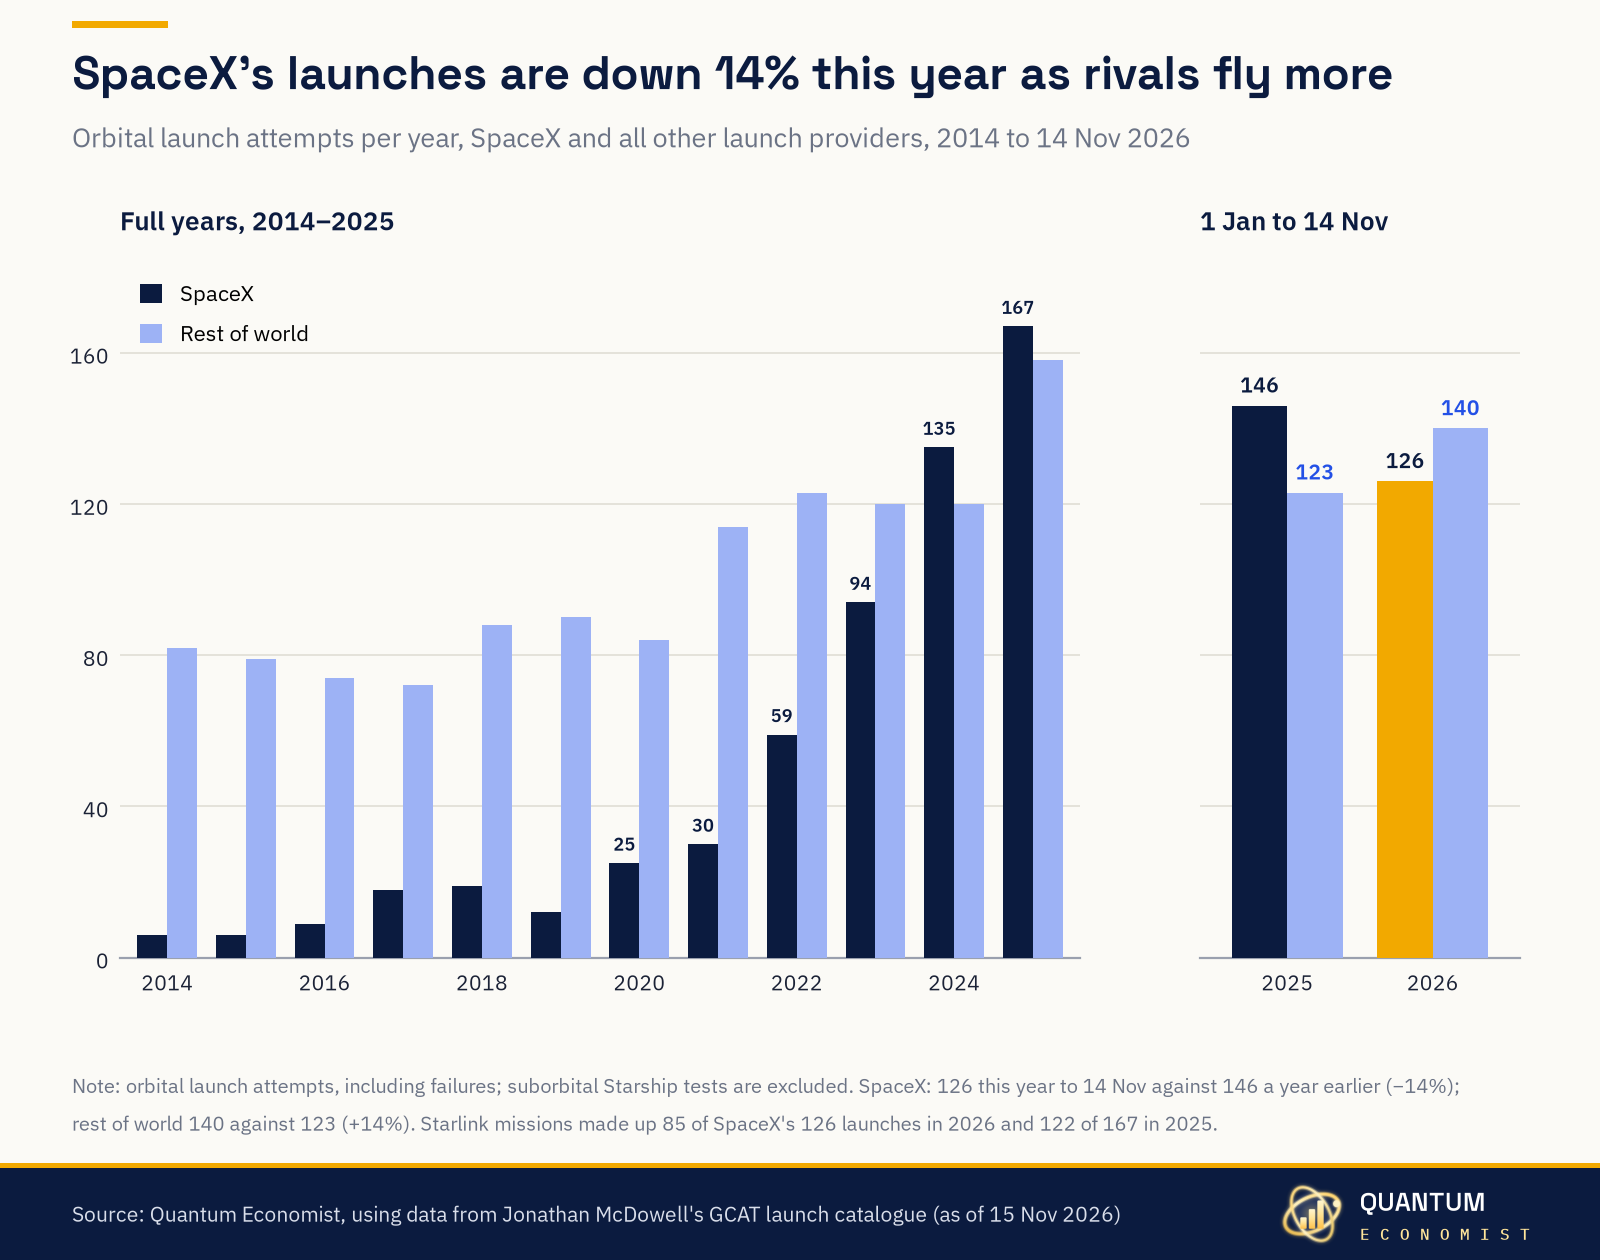
SpaceX made 126 orbital launch attempts between 1 January and 14 November 2026, 14% fewer than the 146 by the same date in 2025. The rest of the world made 140, up 14% from 123, putting it ahead of SpaceX for the first time since 2023 on this measure. Starlink missions made up 85 of SpaceX's 126 launches.
· Source: Quantum Economist, using data from Jonathan McDowell's GCAT launch catalogue
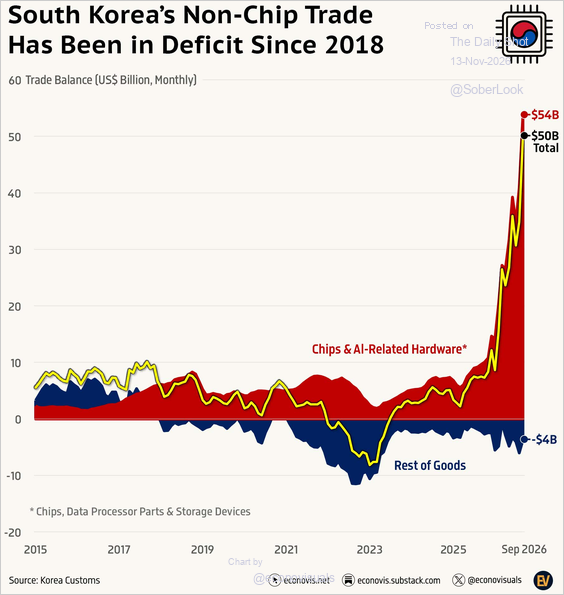
South Korea's trade surplus has come to depend on semiconductors and AI hardware, while other goods have mostly run a deficit since 2018. The AI cycle is now a major driver of Asian trade.
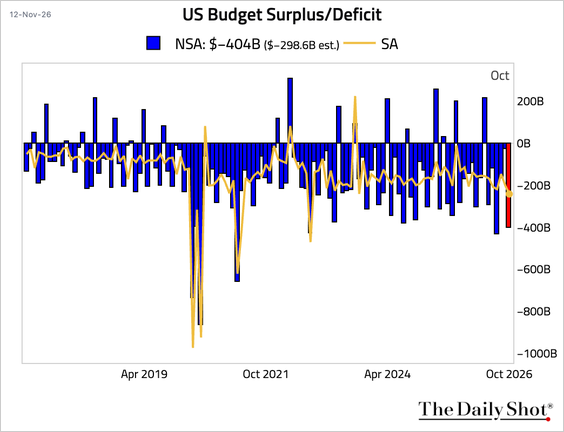
The October federal deficit came in at about $404bn, wider than expected. Heavy borrowing means steady Treasury supply and keeps pressure on long-term yields.
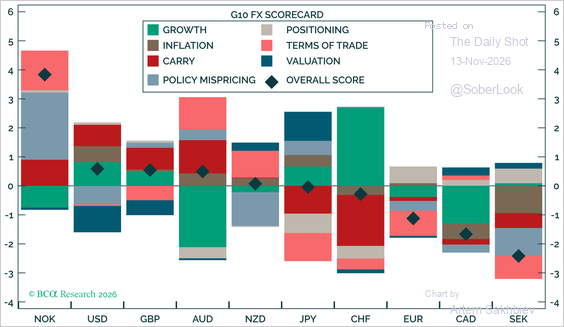
BCA Research's G10 scorecard still favours high-carry currencies, with the Norwegian krone leading by a wide margin. As an oil and gas currency, the krone is one to watch for energy-linked FX.
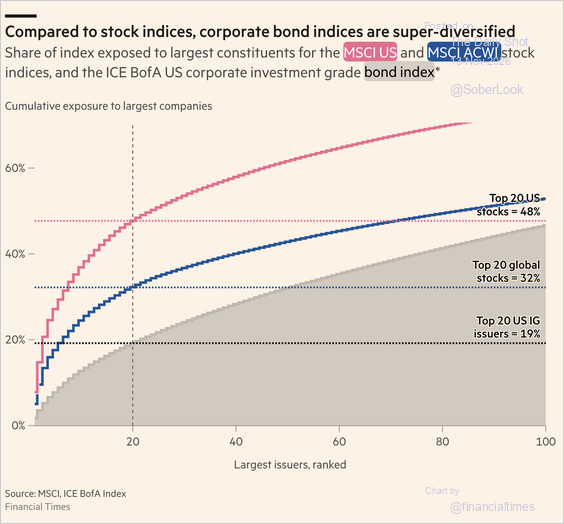
The top 20 issuers make up about 19% of the US investment-grade bond index, against roughly 48% for the top 20 US stocks. Credit carries far less concentration risk than equity benchmarks.
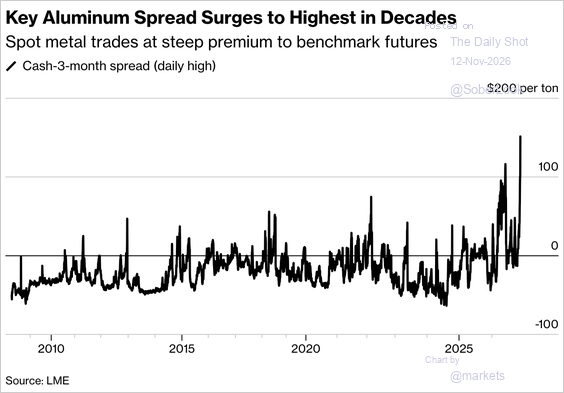
The cash-to-three-month aluminium spread has surged to its highest in decades as inventories tighten. Spot metal now trades at a steep premium to futures, a sign of real strain in the physical market.
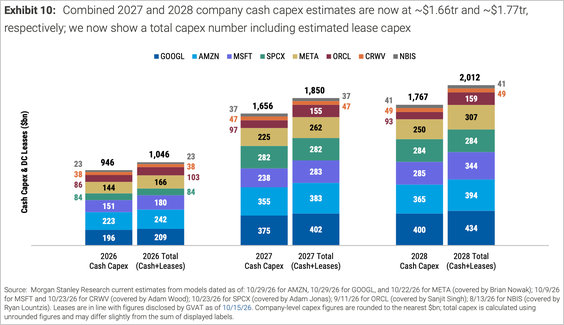
Morgan Stanley sees cash capex across hyperscalers and neoclouds rising from $946bn in 2026 to about $1.66tn in 2027 and $1.77tn in 2028. Spending on that scale means steady growth in data-centre power demand.
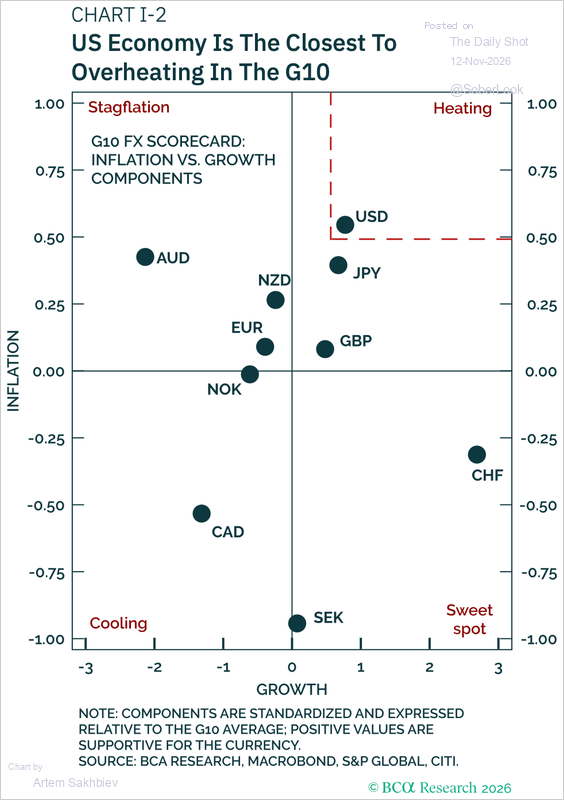
BCA Research stays overweight the dollar near term, as the US scores highest on inflation and second-highest on growth in its G10 scorecard. A firm dollar makes dollar-priced fuels dearer for European buyers.
· Source: BCA Research, Macrobond, S&P Global, Citi
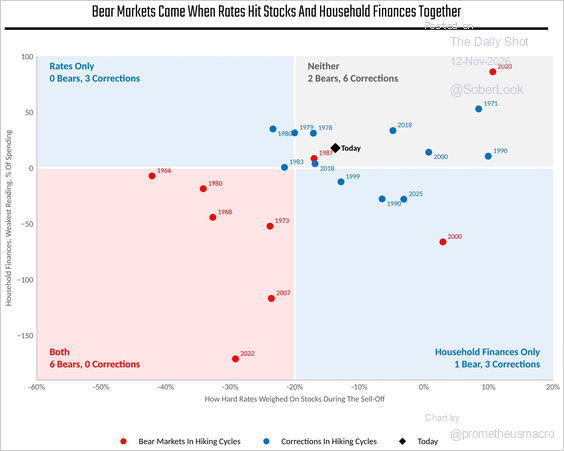
Past bear markets in hiking cycles came when higher rates hit both stocks and household finances. Today only one is under strain, which history links to corrections rather than deeper falls.
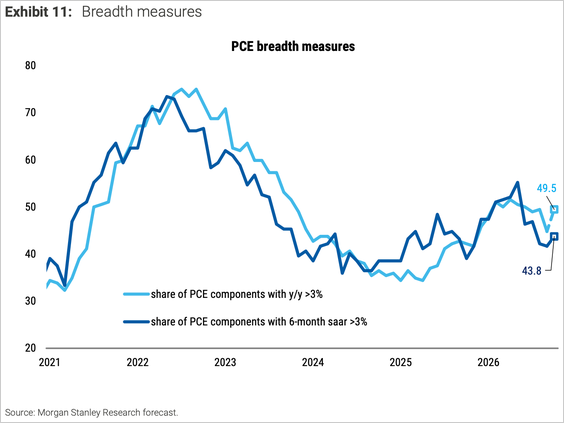
Morgan Stanley estimates that the share of PCE categories with inflation above 3%, a breadth measure Fed Chair Kevin Warsh has highlighted, rose in October. Broader price pressure makes quick rate relief less likely.
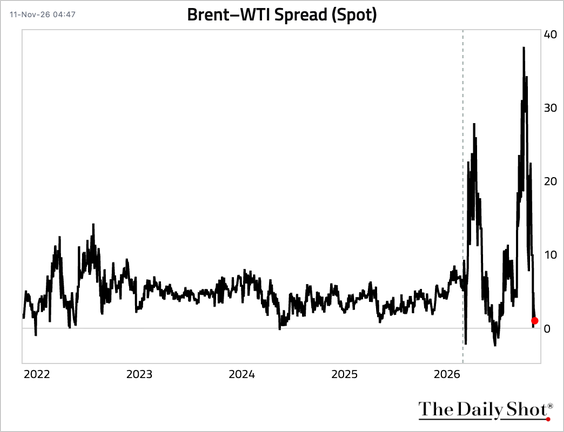
After big swings earlier this year, the Brent premium over WTI has collapsed back to around zero. The Atlantic crude market looks more balanced for now.
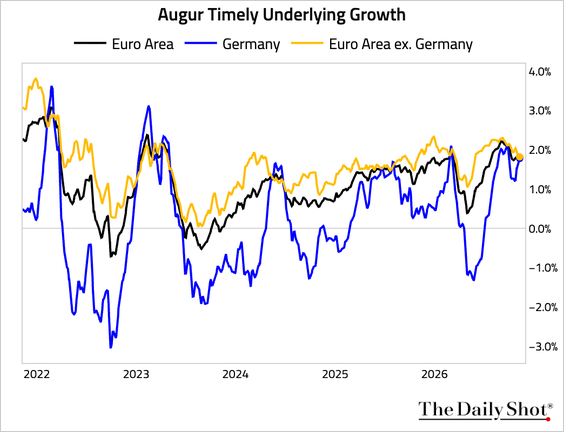
Underlying growth in Germany has converged with its euro-area peers, and its weekly activity index keeps rising. A firmer German economy supports European industrial power and gas demand.
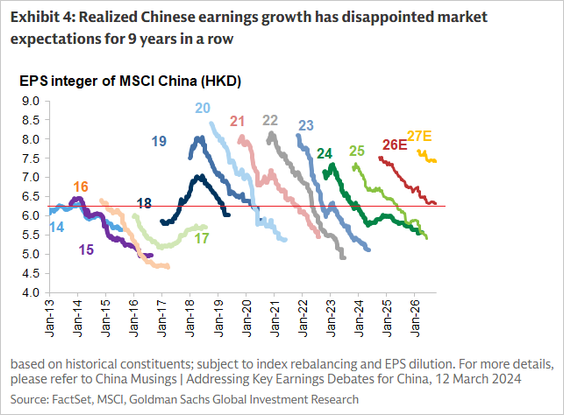
Realised Chinese earnings growth has fallen short of analyst forecasts for nine years in a row. Weak corporate China also caps the pull on global fuels and metals.
· Source: Goldman Sachs Global Investment Research, FactSet, MSCI
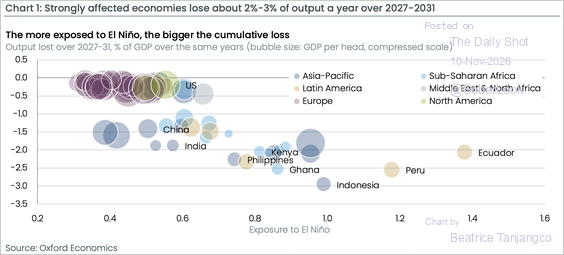
Oxford Economics sees world GDP falling to a trough about 0.9% below baseline in 2028 and staying around 0.7% lower through 2031, with emerging economies hit hardest. Weather risk also feeds straight into hydro, gas and power balances.
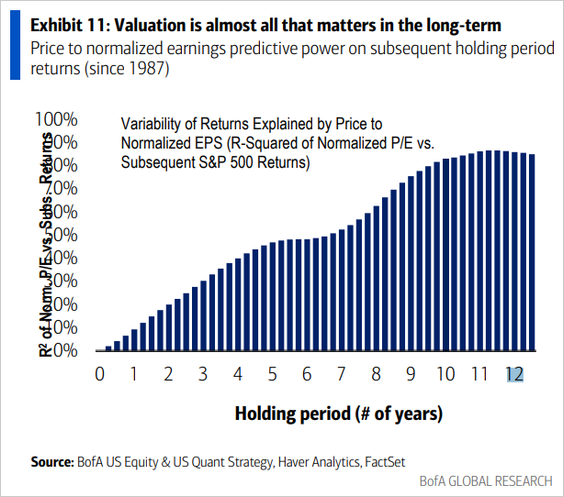
BofA finds that valuations say little about short-term returns but explain most of the S&P 500's long-term returns. Rich multiples today point to more subdued equity gains over the coming decade.
· Source: BofA Global Research, Haver Analytics, FactSet
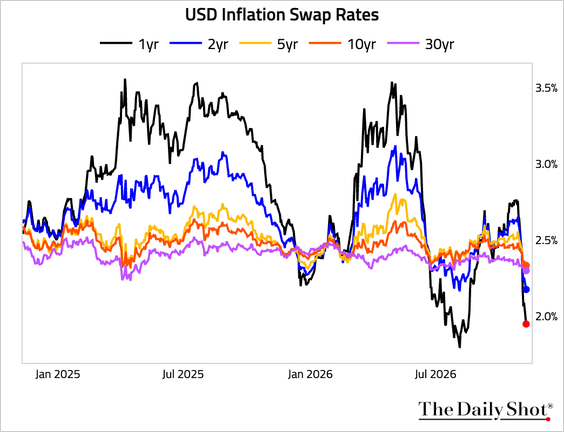
USD inflation swap rates have dropped, with the one-year rate falling hardest. Markets are pricing less near-term inflation even as broader price measures firm.
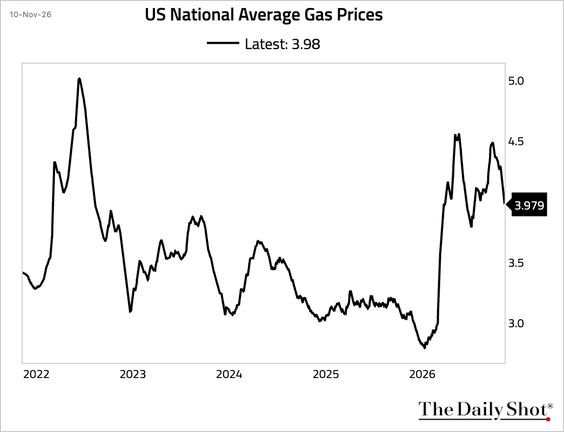
The national average fell below $4 a gallon for the first time since July but is still about 19% above seasonal norms amid lingering supply disruptions. Fuel costs remain a squeeze on US households.
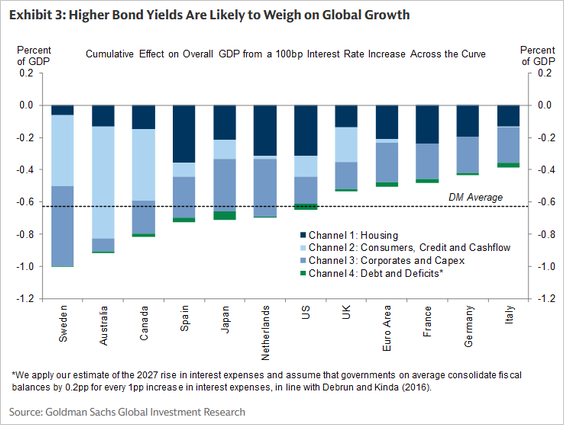
Goldman estimates that a 100bp rise in rates across the curve cuts GDP by about 0.6% on average in developed economies, through housing, consumers, companies and debt costs. Sweden, Australia and Canada look most exposed.
· Source: Goldman Sachs Global Investment Research
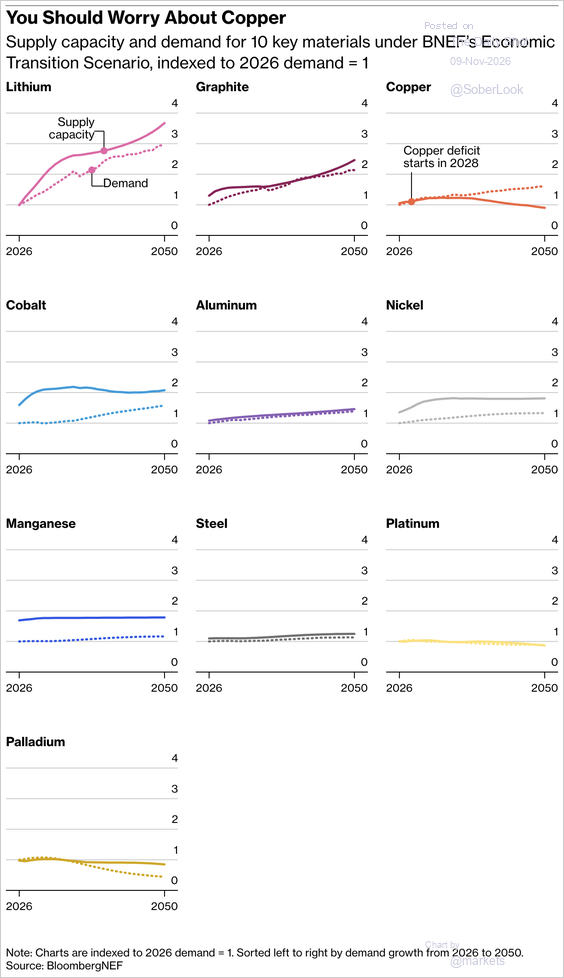
BloombergNEF expects investment to avert shortages in nine of ten critical minerals through 2050, but copper demand is set to exceed supply from 2028. Grids and electrification lean heavily on the metal.
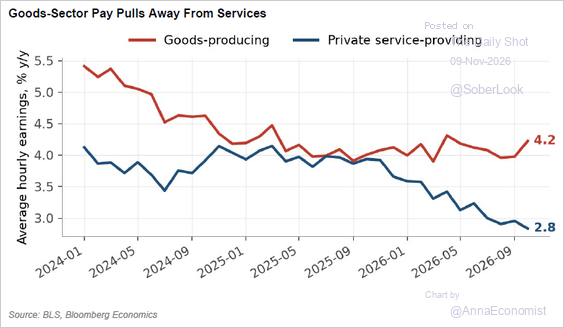
Average hourly earnings in goods-producing industries are rising about 4.2% a year, against roughly 2.8% in private services. Cooler services pay should help ease the stickiest part of US inflation.